Regions Bank 2012 Annual Report Download - page 228
Download and view the complete annual report
Please find page 228 of the 2012 Regions Bank annual report below. You can navigate through the pages in the report by either clicking on the pages listed below, or by using the keyword search tool below to find specific information within the annual report.-
 1
1 -
2
-
3
-
4
-
5
-
6
-
7
-
8
-
9
-
10
-
11
-
12
-
13
-
14
-
15
-
16
-
17
-
18
-
19
-
20
-
21
-
22
-
23
-
24
-
25
-
26
-
27
-
28
-
29
-
30
-
31
-
32
-
33
-
34
-
35
-
36
-
37
-
38
-
39
-
40
-
41
-
42
-
43
-
44
-
45
-
46
-
47
-
48
-
49
-
50
-
51
-
52
-
53
-
54
-
55
-
56
-
57
-
58
-
59
-
60
-
61
-
62
-
63
-
64
-
65
-
66
-
67
-
68
-
69
-
70
-
71
-
72
-
73
-
74
-
75
-
76
-
77
-
78
-
79
-
80
-
81
-
82
-
83
-
84
-
85
-
86
-
87
-
88
-
89
-
90
-
91
-
92
-
93
-
94
-
95
-
96
-
97
-
98
-
99
-
100
-
101
-
102
-
103
-
104
-
105
-
106
-
107
-
108
-
109
-
110
-
111
-
112
-
113
-
114
-
115
-
116
-
117
-
118
-
119
-
120
-
121
-
122
-
123
-
124
-
125
-
126
-
127
-
128
-
129
-
130
-
131
-
132
-
133
-
134
-
135
-
136
-
137
-
138
-
139
-
140
-
141
-
142
-
143
-
144
-
145
-
146
-
147
-
148
-
149
-
150
-
151
-
152
-
153
-
154
-
155
-
156
-
157
-
158
-
159
-
160
-
161
-
162
-
163
-
164
-
165
-
166
-
167
-
168
-
169
-
170
-
171
-
172
-
173
-
174
-
175
-
176
-
177
-
178
-
179
-
180
-
181
-
182
-
183
-
184
-
185
-
186
-
187
-
188
-
189
-
190
-
191
-
192
-
193
-
194
-
195
-
196
-
197
-
198
-
199
-
200
-
201
-
202
-
203
-
204
-
205
-
206
-
207
-
208
-
209
-
210
-
211
-
212
-
213
-
214
-
215
-
216
-
217
-
 218
218 -
 219
219 -
 220
220 -
 221
221 -
 222
222 -
 223
223 -
 224
224 -
 225
225 -
 226
226 -
 227
227 -
 228
228 -
 229
229 -
 230
230 -
 231
231 -
 232
232 -
 233
233 -
 234
234 -
 235
235 -
 236
236 -
 237
237 -
 238
238 -
239
-
240
-
241
-
242
-
243
-
244
-
245
-
246
-
247
-
248
-
249
-
250
-
251
-
252
-
253
-
254
 |
 |

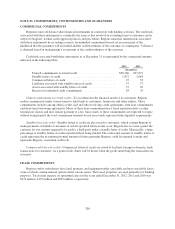
VISA INDEMNIFICATION
As a member of the Visa USA network, Regions, along with other members, indemnified Visa USA against
litigation. On October 3, 2007, Visa USA was restructured and acquired several Visa affiliates. In conjunction
with this restructuring, Regions’ indemnification of Visa USA was modified to cover specific litigation
(“covered litigation”). Regions’ liability recognized under this indemnification was approximately $22 million at
both December 31, 2012 and 2011.
On March 25, 2008, Visa executed an initial public offering (“IPO”) of common stock and, in connection
with the IPO, Regions’ ownership interest in Visa was converted into Class B common stock of approximately
3.8 million shares. In the first quarter of 2008, Visa redeemed approximately 1.5 million shares of the Class B
common stock from Regions for proceeds of approximately $63 million, all of which was recorded as other
income in the consolidated statements of operations. In the second quarter of 2009, Regions sold the remaining
Class B common stock to a third party. The sale resulted in a pre-tax gain of $80 million.
A portion of Visa’s proceeds from the IPO was escrowed to fund the covered litigation. To the extent that
the amount available under the escrow arrangement is insufficient to fully resolve the covered litigation, Visa
will enforce the indemnification obligations of Visa USA’s members for any excess amount.
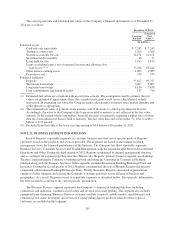
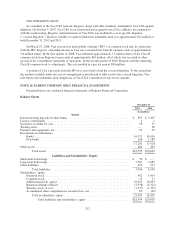
NOTE 24. PARENT COMPANY ONLY FINANCIAL STATEMENTS
Presented below are condensed financial statements of Regions Financial Corporation:
Balance Sheets
December 31
2012 2011
(In millions)
Assets
Interest-bearing deposits in other banks .......................................... $ 857 $ 2,497
Loans to subsidiaries ......................................................... 1 1
Securities available for sale .................................................... 29 31
Trading assets .............................................................. — 20
Premises and equipment, net ................................................... 23 25
Investments in subsidiaries:
Banks ................................................................. 16,955 16,436
Non-banks ............................................................. 246 1,188
17,201 17,624
Other assets ................................................................ 484 405
Total assets ........................................................ $18,595 $20,603
Liabilities and Stockholders’ Equity
Short-term borrowings ....................................................... $ 70 $ —
Long-term borrowings ........................................................ 2,567 3,887
Other liabilities ............................................................. 459 217
Total liabilities ..................................................... 3,096 4,104
Stockholders’ equity:
Preferred stock .......................................................... 482 3,419
Common stock .......................................................... 15 13
Additional paid-in capital ................................................. 19,652 18,855
Retained earnings (deficit) ................................................ (3,338) (4,322)
Treasury stock, at cost .................................................... (1,377) (1,397)
Accumulated other comprehensive income (loss), net ........................... 65 (69)
Total stockholders’ equity ............................................. 15,499 16,499
Total liabilities and stockholders’ equity ............................. $18,595 $20,603
212