Regions Bank 2012 Annual Report Download - page 77
Download and view the complete annual report
Please find page 77 of the 2012 Regions Bank annual report below. You can navigate through the pages in the report by either clicking on the pages listed below, or by using the keyword search tool below to find specific information within the annual report.-
 1
1 -
2
-
3
-
4
-
5
-
6
-
7
-
8
-
9
-
10
-
11
-
12
-
13
-
14
-
15
-
16
-
17
-
18
-
19
-
20
-
21
-
22
-
23
-
24
-
25
-
26
-
27
-
28
-
29
-
30
-
31
-
32
-
33
-
34
-
35
-
36
-
37
-
38
-
39
-
40
-
41
-
42
-
43
-
44
-
45
-
46
-
47
-
48
-
49
-
50
-
51
-
52
-
53
-
54
-
55
-
56
-
57
-
58
-
59
-
60
-
61
-
62
-
63
-
64
-
65
-
66
-
 67
67 -
 68
68 -
 69
69 -
 70
70 -
 71
71 -
 72
72 -
 73
73 -
 74
74 -
 75
75 -
 76
76 -
 77
77 -
 78
78 -
 79
79 -
 80
80 -
 81
81 -
 82
82 -
 83
83 -
 84
84 -
 85
85 -
 86
86 -
 87
87 -
88
-
89
-
90
-
91
-
92
-
93
-
94
-
95
-
96
-
97
-
98
-
99
-
100
-
101
-
102
-
103
-
104
-
105
-
106
-
107
-
108
-
109
-
110
-
111
-
112
-
113
-
114
-
115
-
116
-
117
-
118
-
119
-
120
-
121
-
122
-
123
-
124
-
125
-
126
-
127
-
128
-
129
-
130
-
131
-
132
-
133
-
134
-
135
-
136
-
137
-
138
-
139
-
140
-
141
-
142
-
143
-
144
-
145
-
146
-
147
-
148
-
149
-
150
-
151
-
152
-
153
-
154
-
155
-
156
-
157
-
158
-
159
-
160
-
161
-
162
-
163
-
164
-
165
-
166
-
167
-
168
-
169
-
170
-
171
-
172
-
173
-
174
-
175
-
176
-
177
-
178
-
179
-
180
-
181
-
182
-
183
-
184
-
185
-
186
-
187
-
188
-
189
-
190
-
191
-
192
-
193
-
194
-
195
-
196
-
197
-
198
-
199
-
200
-
201
-
202
-
203
-
204
-
205
-
206
-
207
-
208
-
209
-
210
-
211
-
212
-
213
-
214
-
215
-
216
-
217
-
218
-
219
-
220
-
221
-
222
-
223
-
224
-
225
-
226
-
227
-
228
-
229
-
230
-
231
-
232
-
233
-
234
-
235
-
236
-
237
-
238
-
239
-
240
-
241
-
242
-
243
-
244
-
245
-
246
-
247
-
248
-
249
-
250
-
251
-
252
-
253
-
254
 |
 |
Refer to the discussion of intangible assets in Note 1 “Summary of Significant Accounting Policies” to the
consolidated financial statements for a discussion of these approaches and Note 9 “Intangible Assets” for a
discussion of the assumptions. The fair values of assets and liabilities are determined using an exit price concept.
Refer to Note 1 “Summary of Significant Accounting Policies” to the consolidated financial statements for
discussions of the exit price concept and the determination of fair values of financial assets and liabilities.
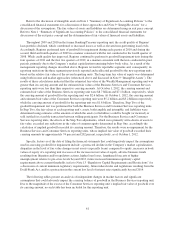
Throughout 2009 and 2010 in the former Banking/Treasury reporting unit, the credit quality of Regions’
loan portfolio declined, which contributed to increased losses as well as elevated non-performing loan levels.
Accordingly, Regions performed tests of goodwill for impairment during each quarter of 2010 and during the
second, third and fourth quarters of 2009 in a manner consistent with the test conducted in the fourth quarter of
2008. While credit quality has improved, Regions continued to perform its goodwill impairment tests during the
four quarters of 2011 and the first two quarters of 2012, in a manner consistent with the tests conducted in prior
periods, primarily due to the Company’s market capitalization remaining below book value. As a result of the
management reporting changes described above, Regions revised its reportable segments and, consequently, its
reporting units from the three segments previously reported and reallocated goodwill to the new reporting units
based on the relative fair values of the revised reporting units. The long-term fair value of equity was determined
using both income and market approaches (referenced above and discussed in Note 9 “Intangible Assets”). The
results of these calculations indicated that the estimated fair value of the Wealth Management reporting unit was
greater than its carrying amount and the estimated fair values of the Business Services and Consumer Services
reporting units were less than their respective carrying amounts. At October 1, 2012, the carrying amount and
estimated fair value of the Business Services reporting unit were $8.7 billion and $7.1 billion, respectively, while
the carrying amount of goodwill for the reporting unit was $2.6 billion. At October 1, 2012, the carrying amount
and estimated fair value of the Consumer Services reporting unit were $5.2 billion and $5.2 billion respectively,
while the carrying amount of goodwill for the reporting unit was $1.8 billion. Therefore, Step Two of the
goodwill impairment test was performed for both the Business Services and Consumer Services reporting units.
In Step Two, the fair values of each reporting unit’s assets, both tangible and intangible, and liabilities were
determined using estimates of the amounts at which the assets (or liabilities) could be bought (or incurred) or
sold (settled) in a taxable transaction between willing participants. For the Business Services and Consumer
Services reporting units, the effects of the Step Two adjustments, which were primarily write-downs of assets to
fair value, exceeded any reductions in the value of common equity determined in Step One; accordingly the
calculation of implied goodwill exceeded its carrying amount. Therefore, the results were no impairment for the
Business Services and Consumer Services reporting units, whose implied fair value of goodwill exceeded their
carrying amounts by approximately 74 percent and 202 percent, respectively, as of October 1, 2012.
Specific factors as of the date of filing the financial statements that could negatively impact the assumptions
used in assessing goodwill for impairment include: a protracted decline in the Company’s market capitalization,
disparities in the level of fair value changes in net assets (especially loans) compared to equity, increases in book
values of equity of a reporting unit in excess of the increase in fair value of equity, adverse business trends
resulting from litigation and/or regulatory actions, higher loan losses, lengthened forecasts of higher
unemployment relative to pre-crisis levels beyond 2013, future increased minimum regulatory capital
requirements above current thresholds (refer to Note 13 “Regulatory Capital Requirements and Restrictions” for
a discussion of current minimum regulatory requirements), future federal rules and regulations resulting from the
Dodd-Frank Act, and/or a protraction in the current low level of interest rates significantly beyond 2014.
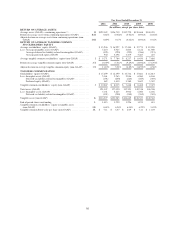
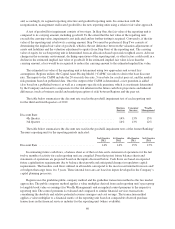
The following tables present an analysis of independent changes in market factors and significant
assumptions that could adversely impact the carrying balance of goodwill in the Business Services reporting unit.
Due to the magnitude of the excess of the Consumer Services reporting unit’s implied fair value of goodwill over
its carrying amount, no such table has been included for this reporting unit.
61