Regions Bank 2012 Annual Report Download - page 161
Download and view the complete annual report
Please find page 161 of the 2012 Regions Bank annual report below. You can navigate through the pages in the report by either clicking on the pages listed below, or by using the keyword search tool below to find specific information within the annual report.-
 1
1 -
2
-
3
-
4
-
5
-
6
-
7
-
8
-
9
-
10
-
11
-
12
-
13
-
14
-
15
-
16
-
17
-
18
-
19
-
20
-
21
-
22
-
23
-
24
-
25
-
26
-
27
-
28
-
29
-
30
-
31
-
32
-
33
-
34
-
35
-
36
-
37
-
38
-
39
-
40
-
41
-
42
-
43
-
44
-
45
-
46
-
47
-
48
-
49
-
50
-
51
-
52
-
53
-
54
-
55
-
56
-
57
-
58
-
59
-
60
-
61
-
62
-
63
-
64
-
65
-
66
-
67
-
68
-
69
-
70
-
71
-
72
-
73
-
74
-
75
-
76
-
77
-
78
-
79
-
80
-
81
-
82
-
83
-
84
-
85
-
86
-
87
-
88
-
89
-
90
-
91
-
92
-
93
-
94
-
95
-
96
-
97
-
98
-
99
-
100
-
101
-
102
-
103
-
104
-
105
-
106
-
107
-
108
-
109
-
110
-
111
-
112
-
113
-
114
-
115
-
116
-
117
-
118
-
119
-
120
-
121
-
122
-
123
-
124
-
125
-
126
-
127
-
128
-
129
-
130
-
131
-
132
-
133
-
134
-
135
-
136
-
137
-
138
-
139
-
140
-
141
-
142
-
143
-
144
-
145
-
146
-
147
-
148
-
149
-
150
-
 151
151 -
 152
152 -
 153
153 -
 154
154 -
 155
155 -
 156
156 -
 157
157 -
 158
158 -
 159
159 -
 160
160 -
 161
161 -
 162
162 -
 163
163 -
 164
164 -
 165
165 -
 166
166 -
 167
167 -
 168
168 -
 169
169 -
 170
170 -
 171
171 -
172
-
173
-
174
-
175
-
176
-
177
-
178
-
179
-
180
-
181
-
182
-
183
-
184
-
185
-
186
-
187
-
188
-
189
-
190
-
191
-
192
-
193
-
194
-
195
-
196
-
197
-
198
-
199
-
200
-
201
-
202
-
203
-
204
-
205
-
206
-
207
-
208
-
209
-
210
-
211
-
212
-
213
-
214
-
215
-
216
-
217
-
218
-
219
-
220
-
221
-
222
-
223
-
224
-
225
-
226
-
227
-
228
-
229
-
230
-
231
-
232
-
233
-
234
-
235
-
236
-
237
-
238
-
239
-
240
-
241
-
242
-
243
-
244
-
245
-
246
-
247
-
248
-
249
-
250
-
251
-
252
-
253
-
254
 |
 |

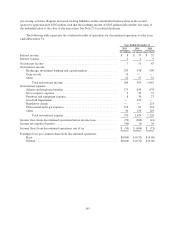
pre-closing activities. Regions increased existing liabilities on the consolidated balance sheet in the second
quarter by approximately $256 million such that the resulting amount of $385 million reflected the fair value of
the indemnification at the close of the transaction. See Note 23 for related disclosure.
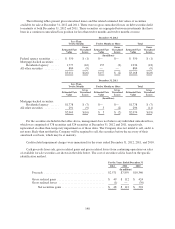
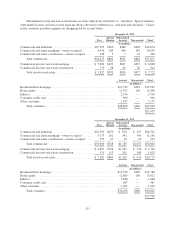
The following table represents the condensed results of operations for discontinued operations for the years
ended December 31:
Year Ended December 31
2012 2011 2010
(In millions, except per share data)
Interest income ..................................................... $ 8 $ 37 $ 52
Interest expense .................................................... 1 6 9
Net interest income ................................................. 7 31 43
Non-interest income:
Brokerage, investment banking and capital markets .................... 233 938 990
Gain on sale ................................................... 19 — —
Other ........................................................ 12 57 52
Total non-interest income .................................... 264 995 1,042
Non-interest expense:
Salaries and employee benefits .................................... 171 644 678
Net occupancy expense .......................................... 9 36 37
Furniture and equipment expense .................................. 8 30 27
Goodwill impairment ............................................ — 492 —
Regulatory charge .............................................. — — 125
Professional and legal expenses .................................... 152 93 134
Other ........................................................ 30 139 125
Total non-interest expense .................................... 370 1,434 1,126
Income (loss) from discontinued operations before income taxes ............. (99) (408) (41)
Income tax expense (benefit) .......................................... (40) (4) 30
Income (loss) from discontinued operations, net of tax ..................... $ (59) $ (404) $ (71)
Earnings (loss) per common share from discontinued operations:
Basic ........................................................ $(0.04) $ (0.32) $ (0.06)
Diluted ....................................................... $(0.04) $ (0.32) $ (0.06)
145