Regions Bank 2012 Annual Report Download - page 107
Download and view the complete annual report
Please find page 107 of the 2012 Regions Bank annual report below. You can navigate through the pages in the report by either clicking on the pages listed below, or by using the keyword search tool below to find specific information within the annual report.-
 1
1 -
2
-
3
-
4
-
5
-
6
-
7
-
8
-
9
-
10
-
11
-
12
-
13
-
14
-
15
-
16
-
17
-
18
-
19
-
20
-
21
-
22
-
23
-
24
-
25
-
26
-
27
-
28
-
29
-
30
-
31
-
32
-
33
-
34
-
35
-
36
-
37
-
38
-
39
-
40
-
41
-
42
-
43
-
44
-
45
-
46
-
47
-
48
-
49
-
50
-
51
-
52
-
53
-
54
-
55
-
56
-
57
-
58
-
59
-
60
-
61
-
62
-
63
-
64
-
65
-
66
-
67
-
68
-
69
-
70
-
71
-
72
-
73
-
74
-
75
-
76
-
77
-
78
-
79
-
80
-
81
-
82
-
83
-
84
-
85
-
86
-
87
-
88
-
89
-
90
-
91
-
92
-
93
-
94
-
95
-
96
-
 97
97 -
 98
98 -
 99
99 -
 100
100 -
 101
101 -
 102
102 -
 103
103 -
 104
104 -
 105
105 -
 106
106 -
 107
107 -
 108
108 -
 109
109 -
 110
110 -
 111
111 -
 112
112 -
 113
113 -
 114
114 -
 115
115 -
 116
116 -
 117
117 -
118
-
119
-
120
-
121
-
122
-
123
-
124
-
125
-
126
-
127
-
128
-
129
-
130
-
131
-
132
-
133
-
134
-
135
-
136
-
137
-
138
-
139
-
140
-
141
-
142
-
143
-
144
-
145
-
146
-
147
-
148
-
149
-
150
-
151
-
152
-
153
-
154
-
155
-
156
-
157
-
158
-
159
-
160
-
161
-
162
-
163
-
164
-
165
-
166
-
167
-
168
-
169
-
170
-
171
-
172
-
173
-
174
-
175
-
176
-
177
-
178
-
179
-
180
-
181
-
182
-
183
-
184
-
185
-
186
-
187
-
188
-
189
-
190
-
191
-
192
-
193
-
194
-
195
-
196
-
197
-
198
-
199
-
200
-
201
-
202
-
203
-
204
-
205
-
206
-
207
-
208
-
209
-
210
-
211
-
212
-
213
-
214
-
215
-
216
-
217
-
218
-
219
-
220
-
221
-
222
-
223
-
224
-
225
-
226
-
227
-
228
-
229
-
230
-
231
-
232
-
233
-
234
-
235
-
236
-
237
-
238
-
239
-
240
-
241
-
242
-
243
-
244
-
245
-
246
-
247
-
248
-
249
-
250
-
251
-
252
-
253
-
254
 |
 |

Premises and Equipment
Premises and equipment are stated at cost, less accumulated depreciation and amortization, as applicable.
Premises and equipment at December 31, 2012 decreased $96 million to $2.3 billion compared to year-end 2011.
This decrease primarily resulted from the sale of Morgan Keegan and depreciation expense on existing assets.
Goodwill
Goodwill totaled $4.8 billion at both December 31, 2012 and 2011 and was reallocated to the new reporting
units during 2012. Refer to the “Critical Accounting Policies” section earlier in this report for detailed
discussions of the Company’s methodology for testing goodwill for impairment. Refer to Note 1 “Summary of
Significant Accounting Policies” and Note 9 “Intangible Assets” to the consolidated financial statements for the
methodologies and assumptions used in Step One of the goodwill impairment test and further details on the
reallocation. Additionally, Note 1 “Summary of Significant Accounting Policies” to the consolidated financial
statements includes information related to the fair value measurements of certain assets and liabilities and the
valuation methodology of such pricing, which is also used for testing goodwill for impairment.
Mortgage Servicing Rights
Mortgage servicing rights at December 31, 2012 totaled $191 million compared to $182 million at
December 31, 2011. An analysis of mortgage servicing rights is presented in Note 7 “Servicing of Financial
Assets” to the consolidated financial statements. The balances shown represent the right to service mortgage
loans that are owned by other investors and are presented at fair value. Data and assumptions used in the fair
value calculation, as well as certain sensitivity estimates, are also presented in Note 7.
Other Identifiable Intangible Assets
Other identifiable intangible assets totaled $345 million at December 31, 2012 compared to $449 million at
December 31, 2011. The year-over-year decrease was due to amortization of core deposit intangibles and the
purchased credit card intangibles. See Note 9 “Intangible Assets” to the consolidated financial statements for
further information.
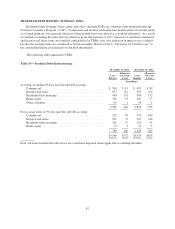
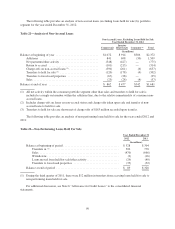
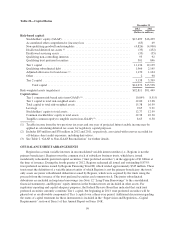
Foreclosed Properties
Other real estate and certain other assets acquired in foreclosure are reported at the lower of the investment
in the loan or fair value of the property less estimated costs to sell. The following table summarizes foreclosed
property activity for the years ended December 31:
Table 23—Foreclosed Properties
2012 2011
(In millions)
Balance at beginning of year ............................................ $296 $454
Transfer from loans ............................................... 294 532
Valuation adjustments ............................................. (66) (161)
Foreclosed property sold ........................................... (370) (518)
Payments and other ................................................ (5) (11)
(147) (158)
Balance at end of year ................................................. $149 $296
Note: Approximately 96 percent and 73 percent of the ending balances as of December 31, 2012 and 2011,
respectively, relates to properties transferred into foreclosed properties during the corresponding calendar year.
91