Regions Bank 2012 Annual Report Download - page 229
Download and view the complete annual report
Please find page 229 of the 2012 Regions Bank annual report below. You can navigate through the pages in the report by either clicking on the pages listed below, or by using the keyword search tool below to find specific information within the annual report.-
 1
1 -
2
-
3
-
4
-
5
-
6
-
7
-
8
-
9
-
10
-
11
-
12
-
13
-
14
-
15
-
16
-
17
-
18
-
19
-
20
-
21
-
22
-
23
-
24
-
25
-
26
-
27
-
28
-
29
-
30
-
31
-
32
-
33
-
34
-
35
-
36
-
37
-
38
-
39
-
40
-
41
-
42
-
43
-
44
-
45
-
46
-
47
-
48
-
49
-
50
-
51
-
52
-
53
-
54
-
55
-
56
-
57
-
58
-
59
-
60
-
61
-
62
-
63
-
64
-
65
-
66
-
67
-
68
-
69
-
70
-
71
-
72
-
73
-
74
-
75
-
76
-
77
-
78
-
79
-
80
-
81
-
82
-
83
-
84
-
85
-
86
-
87
-
88
-
89
-
90
-
91
-
92
-
93
-
94
-
95
-
96
-
97
-
98
-
99
-
100
-
101
-
102
-
103
-
104
-
105
-
106
-
107
-
108
-
109
-
110
-
111
-
112
-
113
-
114
-
115
-
116
-
117
-
118
-
119
-
120
-
121
-
122
-
123
-
124
-
125
-
126
-
127
-
128
-
129
-
130
-
131
-
132
-
133
-
134
-
135
-
136
-
137
-
138
-
139
-
140
-
141
-
142
-
143
-
144
-
145
-
146
-
147
-
148
-
149
-
150
-
151
-
152
-
153
-
154
-
155
-
156
-
157
-
158
-
159
-
160
-
161
-
162
-
163
-
164
-
165
-
166
-
167
-
168
-
169
-
170
-
171
-
172
-
173
-
174
-
175
-
176
-
177
-
178
-
179
-
180
-
181
-
182
-
183
-
184
-
185
-
186
-
187
-
188
-
189
-
190
-
191
-
192
-
193
-
194
-
195
-
196
-
197
-
198
-
199
-
200
-
201
-
202
-
203
-
204
-
205
-
206
-
207
-
208
-
209
-
210
-
211
-
212
-
213
-
214
-
215
-
216
-
217
-
218
-
 219
219 -
 220
220 -
 221
221 -
 222
222 -
 223
223 -
 224
224 -
 225
225 -
 226
226 -
 227
227 -
 228
228 -
 229
229 -
 230
230 -
 231
231 -
 232
232 -
 233
233 -
 234
234 -
 235
235 -
 236
236 -
 237
237 -
 238
238 -
 239
239 -
240
-
241
-
242
-
243
-
244
-
245
-
246
-
247
-
248
-
249
-
250
-
251
-
252
-
253
-
254
 |
 |

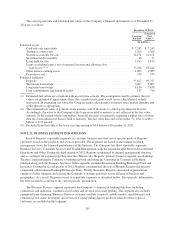
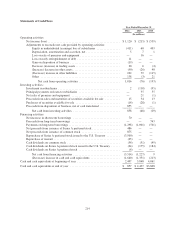
Statements of Operations
Year Ended December 31
2012 2011 2010
(In millions)
Income:
Dividends received from subsidiaries .................................... $ 950 $— $—
Service fees from subsidiaries .......................................... 141 129 128
Interest from subsidiaries ............................................. 4 10 24
Other ............................................................. 2 (5) 7
1,097 134 159
Expenses:
Salaries and employee benefits ......................................... 154 133 117
Interest ............................................................ 165 173 183
Net occupancy expense ............................................... 10 9 9
Furniture and equipment expense ....................................... 3 5 8
Professional and legal fees ............................................ 17 20 21
Other ............................................................. 85 64 50
434 404 388
Income (loss) before income taxes and equity in undistributed earnings (loss) of
subsidiaries ...................................................... 663 (270) (229)
Income tax benefit ................................................... (122) (121) (93)
Income from continuing operations ...................................... 785 (149) (136)
Discontinued operations:
Income (loss) from discontinued operations before income taxes .............. (114) (6) —
Income tax expense (benefit) ........................................... (38) — —
Income (loss) from discontinued operations, net of tax ...................... (76) (6) —
Income (loss) before equity in undistributed earnings (loss) of subsidiaries and
preferred dividends ................................................ 709 (155) (136)
Equity in undistributed earnings (loss) of subsidiaries: ......................
Banks ......................................................... 387 317 (252)
Non-banks ..................................................... 24 (377) (151)
411 (60) (403)
Net income (loss) ........................................................ 1,120 (215) (539)
Preferred stock dividends and accretion ...................................... (129) (214) (224)
Net income (loss) available to common shareholders ............................ $ 991 $(429) $(763)
213