Regions Bank 2012 Annual Report Download - page 185
Download and view the complete annual report
Please find page 185 of the 2012 Regions Bank annual report below. You can navigate through the pages in the report by either clicking on the pages listed below, or by using the keyword search tool below to find specific information within the annual report.-
 1
1 -
2
-
3
-
4
-
5
-
6
-
7
-
8
-
9
-
10
-
11
-
12
-
13
-
14
-
15
-
16
-
17
-
18
-
19
-
20
-
21
-
22
-
23
-
24
-
25
-
26
-
27
-
28
-
29
-
30
-
31
-
32
-
33
-
34
-
35
-
36
-
37
-
38
-
39
-
40
-
41
-
42
-
43
-
44
-
45
-
46
-
47
-
48
-
49
-
50
-
51
-
52
-
53
-
54
-
55
-
56
-
57
-
58
-
59
-
60
-
61
-
62
-
63
-
64
-
65
-
66
-
67
-
68
-
69
-
70
-
71
-
72
-
73
-
74
-
75
-
76
-
77
-
78
-
79
-
80
-
81
-
82
-
83
-
84
-
85
-
86
-
87
-
88
-
89
-
90
-
91
-
92
-
93
-
94
-
95
-
96
-
97
-
98
-
99
-
100
-
101
-
102
-
103
-
104
-
105
-
106
-
107
-
108
-
109
-
110
-
111
-
112
-
113
-
114
-
115
-
116
-
117
-
118
-
119
-
120
-
121
-
122
-
123
-
124
-
125
-
126
-
127
-
128
-
129
-
130
-
131
-
132
-
133
-
134
-
135
-
136
-
137
-
138
-
139
-
140
-
141
-
142
-
143
-
144
-
145
-
146
-
147
-
148
-
149
-
150
-
151
-
152
-
153
-
154
-
155
-
156
-
157
-
158
-
159
-
160
-
161
-
162
-
163
-
164
-
165
-
166
-
167
-
168
-
169
-
170
-
171
-
172
-
173
-
174
-
 175
175 -
 176
176 -
 177
177 -
 178
178 -
 179
179 -
 180
180 -
 181
181 -
 182
182 -
 183
183 -
 184
184 -
 185
185 -
 186
186 -
 187
187 -
 188
188 -
 189
189 -
 190
190 -
 191
191 -
 192
192 -
 193
193 -
 194
194 -
 195
195 -
196
-
197
-
198
-
199
-
200
-
201
-
202
-
203
-
204
-
205
-
206
-
207
-
208
-
209
-
210
-
211
-
212
-
213
-
214
-
215
-
216
-
217
-
218
-
219
-
220
-
221
-
222
-
223
-
224
-
225
-
226
-
227
-
228
-
229
-
230
-
231
-
232
-
233
-
234
-
235
-
236
-
237
-
238
-
239
-
240
-
241
-
242
-
243
-
244
-
245
-
246
-
247
-
248
-
249
-
250
-
251
-
252
-
253
-
254
 |
 |

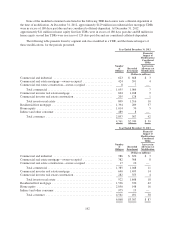
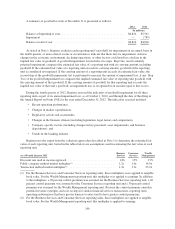
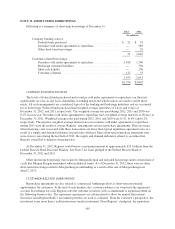
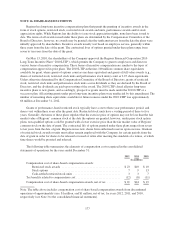
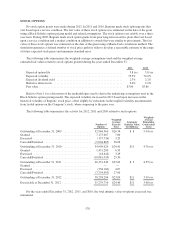
NOTE 11. SHORT-TERM BORROWINGS
Following is a summary of short-term borrowings at December 31:
2012 2011
(In millions)
Company funding sources:
Federal funds purchased .................................. $ 21 $ 18
Securities sold under agreements to repurchase ................ — 969
Other short-term borrowings ............................... — 29
21 1,016
Customer-related borrowings:
Securities sold under agreements to repurchase ................ 1,428 1,346
Brokerage customer liabilities .............................. — 394
Short-sale liability ....................................... — 256
Customer collateral ...................................... 125 55
1,553 2,051
$1,574 $3,067
COMPANY FUNDING SOURCES
The levels of federal funds purchased and securities sold under agreements to repurchase can fluctuate
significantly on a day-to-day basis, depending on funding needs and which sources are used to satisfy those
needs. All such arrangements are considered typical of the banking and brokerage industries and are accounted
for as borrowings. Federal funds purchased had weighted-average maturities of 2 days and 4 days at
December 31, 2012, and 2011, respectively. The weighted-average rate paid during 2012, 2011 and 2010 was
0.1% in each year. Securities sold under agreements to repurchase had a weighted-average maturity of 48 days at
December 31, 2011. Weighted-average rates paid during 2012, 2011 and 2010 were 0.1%, (0.6%) and 0.2%,
respectively. The negative weighted-average interest rates on securities sold under agreements to repurchase
during 2011 were the result of, in part, Regions’ entering into reverse-repurchase agreements. There are times
when financing costs associated with these transactions are lower than typical repurchase agreement rates as a
result of a supply and demand imbalance in particular collateral. Since short-term repurchase agreement rates
were close to zero during the last half of 2011, the supply and demand imbalance related to securities that
Regions owned led to negative financing rates.
At December 31, 2012, Regions could borrow a maximum amount of approximately $19.6 billion from the
Federal Reserve Bank Discount Window. See Note 5 for loans pledged to the Federal Reserve Bank at
December 31, 2012 and 2011.
Other short-term borrowings were related to Morgan Keegan and included borrowings under certain lines of
credit that Morgan Keegan maintained with unaffiliated banks. As of December 31, 2012, there were no other
short-term borrowings related to Morgan Keegan outstanding as a result of the sale of Morgan Keegan on
April 2, 2012.
CUSTOMER-RELATED BORROWINGS
Repurchase agreements are also offered as commercial banking products as short-term investment
opportunities for customers. At the end of each business day, customer balances are swept into the agreement
account. In exchange for cash, Regions sells the customer securities with a commitment to repurchase them on
the following business day. The repurchase agreements are collateralized to allow for market fluctuations.
Securities from Regions Bank’s investment portfolio are used as collateral. From the customer’s perspective, the
investment earns more than a traditional money market instrument. From Regions’ standpoint, the repurchase
169