Regions Bank 2012 Annual Report Download - page 90
Download and view the complete annual report
Please find page 90 of the 2012 Regions Bank annual report below. You can navigate through the pages in the report by either clicking on the pages listed below, or by using the keyword search tool below to find specific information within the annual report.-
 1
1 -
2
-
3
-
4
-
5
-
6
-
7
-
8
-
9
-
10
-
11
-
12
-
13
-
14
-
15
-
16
-
17
-
18
-
19
-
20
-
21
-
22
-
23
-
24
-
25
-
26
-
27
-
28
-
29
-
30
-
31
-
32
-
33
-
34
-
35
-
36
-
37
-
38
-
39
-
40
-
41
-
42
-
43
-
44
-
45
-
46
-
47
-
48
-
49
-
50
-
51
-
52
-
53
-
54
-
55
-
56
-
57
-
58
-
59
-
60
-
61
-
62
-
63
-
64
-
65
-
66
-
67
-
68
-
69
-
70
-
71
-
72
-
73
-
74
-
75
-
76
-
77
-
78
-
79
-
 80
80 -
 81
81 -
 82
82 -
 83
83 -
 84
84 -
 85
85 -
 86
86 -
 87
87 -
 88
88 -
 89
89 -
 90
90 -
 91
91 -
 92
92 -
 93
93 -
 94
94 -
 95
95 -
 96
96 -
 97
97 -
 98
98 -
 99
99 -
 100
100 -
101
-
102
-
103
-
104
-
105
-
106
-
107
-
108
-
109
-
110
-
111
-
112
-
113
-
114
-
115
-
116
-
117
-
118
-
119
-
120
-
121
-
122
-
123
-
124
-
125
-
126
-
127
-
128
-
129
-
130
-
131
-
132
-
133
-
134
-
135
-
136
-
137
-
138
-
139
-
140
-
141
-
142
-
143
-
144
-
145
-
146
-
147
-
148
-
149
-
150
-
151
-
152
-
153
-
154
-
155
-
156
-
157
-
158
-
159
-
160
-
161
-
162
-
163
-
164
-
165
-
166
-
167
-
168
-
169
-
170
-
171
-
172
-
173
-
174
-
175
-
176
-
177
-
178
-
179
-
180
-
181
-
182
-
183
-
184
-
185
-
186
-
187
-
188
-
189
-
190
-
191
-
192
-
193
-
194
-
195
-
196
-
197
-
198
-
199
-
200
-
201
-
202
-
203
-
204
-
205
-
206
-
207
-
208
-
209
-
210
-
211
-
212
-
213
-
214
-
215
-
216
-
217
-
218
-
219
-
220
-
221
-
222
-
223
-
224
-
225
-
226
-
227
-
228
-
229
-
230
-
231
-
232
-
233
-
234
-
235
-
236
-
237
-
238
-
239
-
240
-
241
-
242
-
243
-
244
-
245
-
246
-
247
-
248
-
249
-
250
-
251
-
252
-
253
-
254
 |
 |

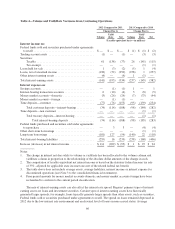
tax rate is also affected by items that may occur in any given period but are not consistent from period to period,
such as the termination of certain leveraged leases. Accordingly, future period effective tax rates may not be
comparable to the current period.
See Note 1 “Summary of Significant Accounting Policies” and Note 19 “Income Taxes” to the consolidated
financial statements for additional information about income taxes.
BALANCE SHEET ANALYSIS
At December 31, 2012, Regions reported total assets of $121.3 billion compared to $127.1 billion at the end
of 2011, a decrease of approximately $5.7 billion or 4 percent. The decrease in total assets from year-end 2011
resulted mainly from a decrease in loans, as well as a decrease in other assets. Loans, net of unearned income,
declined approximately $3.6 billion, primarily related to the investor real estate portfolio segment. Other assets
also declined between years due to decreases in derivative assets and deferred income tax assets, as well as
settlements of securities sales. Also, a decrease in interest-bearing deposits in other banks was largely offset by
an increase in securities available for sale. The decrease in total assets was also driven by a reduction in trading
account assets, which resulted from the closing of the sale of Morgan Keegan (see Note 3 “Discontinued
Operations” to the consolidated financial statements).
Cash and Cash Equivalents
Cash and cash equivalents include cash and due from banks, interest-bearing deposits in other banks
(including the Federal Reserve Bank), and Federal funds sold and securities purchased under agreements to resell
(which have a life of 90 days or less). At December 31, 2012, these assets totaled $5.5 billion as compared to
$7.2 billion at December 31, 2011. The year-over-year decrease was driven by a decrease in interest-bearing
deposits in other banks. These funds were utilized for repurchase of the Series A preferred shares issued to the
U.S. Treasury.
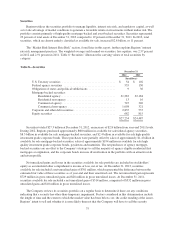
Trading Account Assets
Trading account assets decreased $1.2 billion to $116 million at December 31, 2012. The trading account
assets were primarily held at Morgan Keegan. As discussed above, early in 2012, Regions completed the sale of
Morgan Keegan. Also included in trading account assets are securities held in rabbi trusts related to deferred
compensation plans. Trading account assets are carried at fair value with changes in fair value reflected in the
consolidated statements of operations. Table 7 “Trading Account Assets” illustrates the total carrying values of
trading account assets by category.
Table 7—Trading Account Assets
December 31
2012 2011
(In millions)
Trading account assets:
U.S. Treasury and Federal agency securities .................... $— $ 624
Obligations of states and political subdivisions .................. — 240
Other securities ........................................... 116 402
$116 $1,266
74