Regions Bank 2012 Annual Report Download - page 206
Download and view the complete annual report
Please find page 206 of the 2012 Regions Bank annual report below. You can navigate through the pages in the report by either clicking on the pages listed below, or by using the keyword search tool below to find specific information within the annual report.-
 1
1 -
2
-
3
-
4
-
5
-
6
-
7
-
8
-
9
-
10
-
11
-
12
-
13
-
14
-
15
-
16
-
17
-
18
-
19
-
20
-
21
-
22
-
23
-
24
-
25
-
26
-
27
-
28
-
29
-
30
-
31
-
32
-
33
-
34
-
35
-
36
-
37
-
38
-
39
-
40
-
41
-
42
-
43
-
44
-
45
-
46
-
47
-
48
-
49
-
50
-
51
-
52
-
53
-
54
-
55
-
56
-
57
-
58
-
59
-
60
-
61
-
62
-
63
-
64
-
65
-
66
-
67
-
68
-
69
-
70
-
71
-
72
-
73
-
74
-
75
-
76
-
77
-
78
-
79
-
80
-
81
-
82
-
83
-
84
-
85
-
86
-
87
-
88
-
89
-
90
-
91
-
92
-
93
-
94
-
95
-
96
-
97
-
98
-
99
-
100
-
101
-
102
-
103
-
104
-
105
-
106
-
107
-
108
-
109
-
110
-
111
-
112
-
113
-
114
-
115
-
116
-
117
-
118
-
119
-
120
-
121
-
122
-
123
-
124
-
125
-
126
-
127
-
128
-
129
-
130
-
131
-
132
-
133
-
134
-
135
-
136
-
137
-
138
-
139
-
140
-
141
-
142
-
143
-
144
-
145
-
146
-
147
-
148
-
149
-
150
-
151
-
152
-
153
-
154
-
155
-
156
-
157
-
158
-
159
-
160
-
161
-
162
-
163
-
164
-
165
-
166
-
167
-
168
-
169
-
170
-
171
-
172
-
173
-
174
-
175
-
176
-
177
-
178
-
179
-
180
-
181
-
182
-
183
-
184
-
185
-
186
-
187
-
188
-
189
-
190
-
191
-
192
-
193
-
194
-
195
-
 196
196 -
 197
197 -
 198
198 -
 199
199 -
 200
200 -
 201
201 -
 202
202 -
 203
203 -
 204
204 -
 205
205 -
 206
206 -
 207
207 -
 208
208 -
 209
209 -
 210
210 -
 211
211 -
 212
212 -
 213
213 -
 214
214 -
 215
215 -
 216
216 -
217
-
218
-
219
-
220
-
221
-
222
-
223
-
224
-
225
-
226
-
227
-
228
-
229
-
230
-
231
-
232
-
233
-
234
-
235
-
236
-
237
-
238
-
239
-
240
-
241
-
242
-
243
-
244
-
245
-
246
-
247
-
248
-
249
-
250
-
251
-
252
-
253
-
254
 |
 |

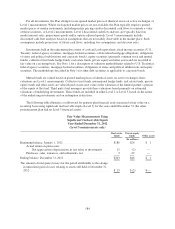
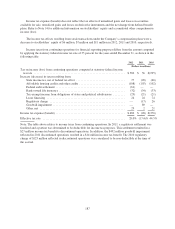
As of December 31, 2012, 2011 and 2010, the balance of the Company’s UTBs that would reduce the
effective tax rate, if recognized, was $40 million, $80 million and $79 million, respectively. The remainder of the
UTB balance has indirect tax benefits in other jurisdictions or is the tax effect of temporary differences.
During 2012, 2011 and 2010, income tax expense (benefit) includes interest expense, interest income and
penalties related to income taxes, before the impact of any applicable federal and state deductions, of zero, ($2)
million and $2 million, respectively. As of December 31, 2012 and December 31, 2011, the Company recognized
a liability of $1 million and $7 million, respectively, for interest and penalties related to income taxes, before the
impact of any applicable federal and state deductions.
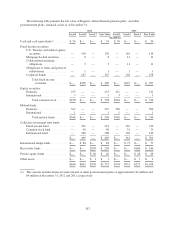
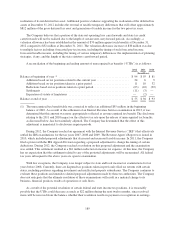
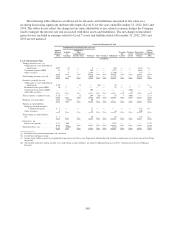
NOTE 20. DERIVATIVE FINANCIAL INSTRUMENTS AND HEDGING ACTIVITIES
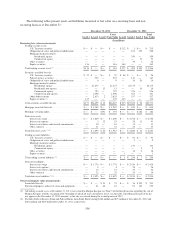
The following tables present the notional and fair value of derivative instruments on a gross basis as of
December 31:
December 31, 2012 December 31, 2011
Notional
Amount
Fair Value Notional
Amount
Fair Value
Gain (1) Loss (1) Gain (1) Loss (1)
(In millions)
Derivatives in fair value hedging relationships:
Interest rate swaps ............................. $ 5,388 $ 101 $ 1 $ 5,535 $ 153 $ 1
Forward commitments .......................... — — — 640 — 11
Derivatives in cash flow hedging relationships:
Interest rate swaps ............................. 1,000 2 — 11,500 209 1
Total derivatives designated as hedging instruments ...... $ 6,388 $ 103 $ 1 $ 17,675 $ 362 $ 13
Derivatives not designated as hedging instruments:
Interest rate swaps (2) ........................... $ 46,054 $1,746 $1,775 $ 59,293 $2,396 $2,414
Interest rate options (3) .......................... 3,274 25 4 4,018 41 28
Interest rate futures and forward commitments(4) ..... 43,908 10 13 70,607 11 23
Other contracts ............................... 2,213 31 32 1,276 43 36
Total derivatives not designated as hedging instruments
(4) ............................................ $ 95,449 $1,812 $1,824 $135,194 $2,491 $2,501
Total derivatives (4) ............................ $101,837 $1,915 $1,825 $152,869 $2,853 $2,514
(1) Derivatives in a gain position are recorded as other assets and derivatives in a loss position are recorded as
other liabilities on the consolidated balance sheets.
(2) Includes Morgan Keegan amounts of $4.2 billion in notional value and $454 million in other assets/other
liabilities as of December 31, 2011.
(3) Includes Morgan Keegan amounts of $364 million in notional value and $23 million in other assets/other
liabilities as of December 31, 2011.
(4) During the third quarter of 2012, the Company discovered an error in the preparation of its derivative
footnote as of December 31, 2011. The error resulted in an overstatement in the disclosed notional value of
derivatives not designated as hedging instruments, specifically interest rate futures and forward
commitments. Management has determined that the effect of this item is immaterial to prior periods and
adjusted the applicable 2011 notional amounts in the derivative footnote.
190