Regions Bank 2012 Annual Report Download - page 117
Download and view the complete annual report
Please find page 117 of the 2012 Regions Bank annual report below. You can navigate through the pages in the report by either clicking on the pages listed below, or by using the keyword search tool below to find specific information within the annual report.-
 1
1 -
2
-
3
-
4
-
5
-
6
-
7
-
8
-
9
-
10
-
11
-
12
-
13
-
14
-
15
-
16
-
17
-
18
-
19
-
20
-
21
-
22
-
23
-
24
-
25
-
26
-
27
-
28
-
29
-
30
-
31
-
32
-
33
-
34
-
35
-
36
-
37
-
38
-
39
-
40
-
41
-
42
-
43
-
44
-
45
-
46
-
47
-
48
-
49
-
50
-
51
-
52
-
53
-
54
-
55
-
56
-
57
-
58
-
59
-
60
-
61
-
62
-
63
-
64
-
65
-
66
-
67
-
68
-
69
-
70
-
71
-
72
-
73
-
74
-
75
-
76
-
77
-
78
-
79
-
80
-
81
-
82
-
83
-
84
-
85
-
86
-
87
-
88
-
89
-
90
-
91
-
92
-
93
-
94
-
95
-
96
-
97
-
98
-
99
-
100
-
101
-
102
-
103
-
104
-
105
-
106
-
 107
107 -
 108
108 -
 109
109 -
 110
110 -
 111
111 -
 112
112 -
 113
113 -
 114
114 -
 115
115 -
 116
116 -
 117
117 -
 118
118 -
 119
119 -
 120
120 -
 121
121 -
 122
122 -
 123
123 -
 124
124 -
 125
125 -
 126
126 -
 127
127 -
128
-
129
-
130
-
131
-
132
-
133
-
134
-
135
-
136
-
137
-
138
-
139
-
140
-
141
-
142
-
143
-
144
-
145
-
146
-
147
-
148
-
149
-
150
-
151
-
152
-
153
-
154
-
155
-
156
-
157
-
158
-
159
-
160
-
161
-
162
-
163
-
164
-
165
-
166
-
167
-
168
-
169
-
170
-
171
-
172
-
173
-
174
-
175
-
176
-
177
-
178
-
179
-
180
-
181
-
182
-
183
-
184
-
185
-
186
-
187
-
188
-
189
-
190
-
191
-
192
-
193
-
194
-
195
-
196
-
197
-
198
-
199
-
200
-
201
-
202
-
203
-
204
-
205
-
206
-
207
-
208
-
209
-
210
-
211
-
212
-
213
-
214
-
215
-
216
-
217
-
218
-
219
-
220
-
221
-
222
-
223
-
224
-
225
-
226
-
227
-
228
-
229
-
230
-
231
-
232
-
233
-
234
-
235
-
236
-
237
-
238
-
239
-
240
-
241
-
242
-
243
-
244
-
245
-
246
-
247
-
248
-
249
-
250
-
251
-
252
-
253
-
254
 |
 |
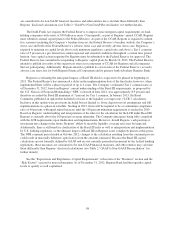
as the aggregation of exposure Regions has with financial institutions, companies, or individuals in a given
country outside of the United States. Credit risk represents the risk that parties indebted to Regions fail to
perform as contractually obligated. Regions’ primary credit risk arises from the possibility that borrowers may
not be able to repay loans, and to a lesser extent, the failure of securities issuers and counterparties to perform as
contractually required.
Management follows a formal process for identifying and documenting key risks facing each line of
business, how those risks can be controlled or mitigated, and how management monitors the controls to ensure
that they are effective. Separate from risk acceptance, there is an independent risk assessment and reporting
program. To ensure that risks within the Company are appropriately addressed, the Board has designated a Risk
Committee of outside directors. The Risk Committee’s focus is on Regions’ overall risk profile, and the
committee receives reports from the Company’s management quarterly. Additionally, Regions’ Internal Audit
Division performs ongoing, independent reviews of the risk management process which are reported to the Audit
Committee of the Board of Directors.
Some of the more significant processes used to manage and control these and other risks are described in the
remainder of this report. External factors beyond management’s control may result in losses despite risk
management efforts.
MARKET RISK—INTEREST RATE RISK
Regions’ primary market risk is interest rate risk, including uncertainty with respect to absolute interest rate
levels as well as uncertainty with respect to relative interest rate levels, which is impacted by both the shape and
the slope of the various yield curves that affect the financial products and services that the Company offers. To
quantify this risk, Regions measures the change in its net interest income in various interest rate scenarios
compared to a base case scenario. Net interest income sensitivity is a useful short-term indicator of Regions’
interest rate risk.
Sensitivity Measurement—Financial simulation models are Regions’ primary tools used to measure interest
rate exposure. Using a wide range of sophisticated simulation techniques provides management with extensive
information on the potential impact to net interest income caused by changes in interest rates. Models are
structured to simulate cash flows and accrual characteristics of Regions’ balance sheet. Assumptions are made
about the direction and volatility of interest rates, the slope of the yield curve, and the changing composition of
the balance sheet that result from both strategic plans and from customer behavior. Among the assumptions are
expectations of balance sheet growth and composition, the pricing and maturity characteristics of existing
business and the characteristics of future business. Interest rate-related risks are expressly considered, such as
pricing spreads, the lag time in pricing deposit accounts, prepayments and other option risks. Regions considers
these factors, as well as the degree of certainty or uncertainty surrounding their future behavior.
The primary objective of asset/liability management at Regions is to coordinate balance sheet composition
with interest rate risk management to sustain a reasonable and stable net interest income throughout various
interest rate cycles. In computing interest rate sensitivity for measurement, Regions compares a set of alternative
interest rate scenarios to the results of a base case scenario based on “market forward rates.” The standard set of
interest rate scenarios includes the traditional instantaneous parallel rate shifts of plus 100 and 200 basis points.
Regions also prepares a minus 50 basis points scenario, as minus 100 and 200 basis point scenarios are not
considered realistic in the current rate environment. Up-rate scenarios of greater magnitude are also analyzed,
and are of increased importance as the current and historic low levels of interest rates increase the relative
likelihood of a rapid and substantial increase in interest rates. Regions also includes simulations of gradual
interest rate movements that may more realistically mimic potential interest rate movements. These gradual
scenarios include curve steepening, flattening, and parallel movements of various magnitudes phased in over a
six-month period, and include rate shifts of minus 50 basis points and plus 100 and 200 basis points.
101