Regions Bank 2012 Annual Report Download - page 113
Download and view the complete annual report
Please find page 113 of the 2012 Regions Bank annual report below. You can navigate through the pages in the report by either clicking on the pages listed below, or by using the keyword search tool below to find specific information within the annual report.-
 1
1 -
2
-
3
-
4
-
5
-
6
-
7
-
8
-
9
-
10
-
11
-
12
-
13
-
14
-
15
-
16
-
17
-
18
-
19
-
20
-
21
-
22
-
23
-
24
-
25
-
26
-
27
-
28
-
29
-
30
-
31
-
32
-
33
-
34
-
35
-
36
-
37
-
38
-
39
-
40
-
41
-
42
-
43
-
44
-
45
-
46
-
47
-
48
-
49
-
50
-
51
-
52
-
53
-
54
-
55
-
56
-
57
-
58
-
59
-
60
-
61
-
62
-
63
-
64
-
65
-
66
-
67
-
68
-
69
-
70
-
71
-
72
-
73
-
74
-
75
-
76
-
77
-
78
-
79
-
80
-
81
-
82
-
83
-
84
-
85
-
86
-
87
-
88
-
89
-
90
-
91
-
92
-
93
-
94
-
95
-
96
-
97
-
98
-
99
-
100
-
101
-
102
-
 103
103 -
 104
104 -
 105
105 -
 106
106 -
 107
107 -
 108
108 -
 109
109 -
 110
110 -
 111
111 -
 112
112 -
 113
113 -
 114
114 -
 115
115 -
 116
116 -
 117
117 -
 118
118 -
 119
119 -
 120
120 -
 121
121 -
 122
122 -
 123
123 -
124
-
125
-
126
-
127
-
128
-
129
-
130
-
131
-
132
-
133
-
134
-
135
-
136
-
137
-
138
-
139
-
140
-
141
-
142
-
143
-
144
-
145
-
146
-
147
-
148
-
149
-
150
-
151
-
152
-
153
-
154
-
155
-
156
-
157
-
158
-
159
-
160
-
161
-
162
-
163
-
164
-
165
-
166
-
167
-
168
-
169
-
170
-
171
-
172
-
173
-
174
-
175
-
176
-
177
-
178
-
179
-
180
-
181
-
182
-
183
-
184
-
185
-
186
-
187
-
188
-
189
-
190
-
191
-
192
-
193
-
194
-
195
-
196
-
197
-
198
-
199
-
200
-
201
-
202
-
203
-
204
-
205
-
206
-
207
-
208
-
209
-
210
-
211
-
212
-
213
-
214
-
215
-
216
-
217
-
218
-
219
-
220
-
221
-
222
-
223
-
224
-
225
-
226
-
227
-
228
-
229
-
230
-
231
-
232
-
233
-
234
-
235
-
236
-
237
-
238
-
239
-
240
-
241
-
242
-
243
-
244
-
245
-
246
-
247
-
248
-
249
-
250
-
251
-
252
-
253
-
254
 |
 |
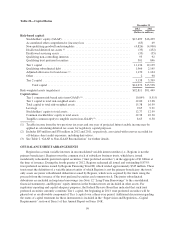
Stockholders’ Equity
Stockholders’ equity was $15.5 billion at year-end 2012 versus $16.5 billion at year-end 2011. On April 4,
2012, Regions repurchased all 3.5 million shares of the Series A preferred stock issued to the U. S. Treasury.
Therefore, during the second quarter of 2012, Regions derecognized the carrying value of the Series A shares in
the amount of approximately $3.4 billion, and recorded approximately $71 million of amortization related to the
remaining unaccreted discount, which reduced net income available to common shareholders. The total reduction
to shareholders’ equity was $3.5 billion. In early May of 2012, Regions repurchased the warrant from the U.S.
Treasury Department for $45 million. The transaction reduced additional paid-in capital within stockholders’
equity by $45 million. The decreases related to the Series A and warrant repurchases were offset by the
March 19, 2012 issuance of 153 million shares of common stock at $5.90 per share. The proceeds from the sale,
net of issuance costs, increased equity by approximately $875 million. On November 1, 2012, Regions issued
$500 million in depositary shares each representing a fractional ownership interest in a share of the Company’s
6.375% Non-Cumulative Perpetual Preferred Stock, Series A, par value $1.00 per share. The net proceeds from
the issuance increased equity by approximately $486 million. In 2012, net income increased stockholders’ equity
by $1.1 billion. Cash dividends declared reduced stockholders’ equity by $54 million related to common stock,
$125 million related to preferred stock issued to the U.S. Treasury, and $4 million related to Series A preferred
stock. Changes in accumulated other comprehensive income increased equity by $134 million.
At December 31, 2012, Regions had 23 million common shares available for repurchase through open
market transactions under an existing share repurchase authorization. There were no treasury stock purchases
through open market transactions during 2012 or 2011.
Regions’ ratio of stockholders’ equity to total assets was 12.77 percent at December 31, 2012 and
12.99 percent December 31, 2011. Regions’ ratio of tangible common stockholders’ equity (stockholders’ equity
less preferred stock, goodwill and other identifiable intangibles and the related deferred tax liability) to total
tangible assets was 8.63 percent at December 31, 2012 compared to 6.58 percent at December 31, 2011 (see
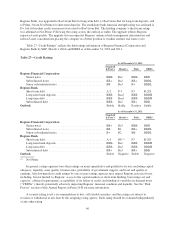
Table 2 “GAAP to Non-GAAP Reconciliation” for further discussion). The increase between years was a result
of the increase in common stockholders’ equity discussed above and a reduction in tangible assets.
Regions’ annual dividend was $0.04 per common share in 2012, 2011 and 2010. Regions understands the
importance of returning capital to shareholders. Management will continue to execute the capital planning
process, including evaluation of the amount of the common dividend, with the Board of Directors and in
conjunction with regulatory supervisors, subject to the Company’s results of operations.
BANK REGULATORY CAPITAL REQUIREMENTS
Regions and Regions Bank are required to comply with regulatory capital requirements established by
Federal and State banking agencies. These regulatory capital requirements involve quantitative measures of the
Company’s assets, liabilities and certain off-balance sheet items, and also qualitative judgments by the
regulators. Failure to meet minimum capital requirements can subject the Company to a series of increasingly
restrictive regulatory actions. Currently, there are two basic measures of capital adequacy: a risk-based measure
and a leverage measure. See Note 13 “Regulatory Capital Requirements and Restrictions” to the consolidated
financial statements for further details.
In recent years, the Federal Reserve and banking regulators began supplementing their assessment of the
capital adequacy of a bank based on a variation of Tier 1 capital, known as Tier 1 common equity. This measure
has been a key component of assessments of capital adequacy under the Comprehensive Capital Analysis and
Review (“CCAR”) process. While not currently prescribed in amount by federal banking regulations, analysts
and banking regulators have assessed Regions’ capital adequacy using the Tier 1 common and/or the tangible
common stockholders’ equity measure. Because tangible common stockholders’ equity and Tier 1 common
equity are not formally defined by GAAP or prescribed in amount by federal banking regulations, these measures
97