Regions Bank 2012 Annual Report Download - page 167
Download and view the complete annual report
Please find page 167 of the 2012 Regions Bank annual report below. You can navigate through the pages in the report by either clicking on the pages listed below, or by using the keyword search tool below to find specific information within the annual report.-
 1
1 -
2
-
3
-
4
-
5
-
6
-
7
-
8
-
9
-
10
-
11
-
12
-
13
-
14
-
15
-
16
-
17
-
18
-
19
-
20
-
21
-
22
-
23
-
24
-
25
-
26
-
27
-
28
-
29
-
30
-
31
-
32
-
33
-
34
-
35
-
36
-
37
-
38
-
39
-
40
-
41
-
42
-
43
-
44
-
45
-
46
-
47
-
48
-
49
-
50
-
51
-
52
-
53
-
54
-
55
-
56
-
57
-
58
-
59
-
60
-
61
-
62
-
63
-
64
-
65
-
66
-
67
-
68
-
69
-
70
-
71
-
72
-
73
-
74
-
75
-
76
-
77
-
78
-
79
-
80
-
81
-
82
-
83
-
84
-
85
-
86
-
87
-
88
-
89
-
90
-
91
-
92
-
93
-
94
-
95
-
96
-
97
-
98
-
99
-
100
-
101
-
102
-
103
-
104
-
105
-
106
-
107
-
108
-
109
-
110
-
111
-
112
-
113
-
114
-
115
-
116
-
117
-
118
-
119
-
120
-
121
-
122
-
123
-
124
-
125
-
126
-
127
-
128
-
129
-
130
-
131
-
132
-
133
-
134
-
135
-
136
-
137
-
138
-
139
-
140
-
141
-
142
-
143
-
144
-
145
-
146
-
147
-
148
-
149
-
150
-
151
-
152
-
153
-
154
-
155
-
156
-
 157
157 -
 158
158 -
 159
159 -
 160
160 -
 161
161 -
 162
162 -
 163
163 -
 164
164 -
 165
165 -
 166
166 -
 167
167 -
 168
168 -
 169
169 -
 170
170 -
 171
171 -
 172
172 -
 173
173 -
 174
174 -
 175
175 -
 176
176 -
 177
177 -
178
-
179
-
180
-
181
-
182
-
183
-
184
-
185
-
186
-
187
-
188
-
189
-
190
-
191
-
192
-
193
-
194
-
195
-
196
-
197
-
198
-
199
-
200
-
201
-
202
-
203
-
204
-
205
-
206
-
207
-
208
-
209
-
210
-
211
-
212
-
213
-
214
-
215
-
216
-
217
-
218
-
219
-
220
-
221
-
222
-
223
-
224
-
225
-
226
-
227
-
228
-
229
-
230
-
231
-
232
-
233
-
234
-
235
-
236
-
237
-
238
-
239
-
240
-
241
-
242
-
243
-
244
-
245
-
246
-
247
-
248
-
249
-
250
-
251
-
252
-
253
-
254
 |
 |
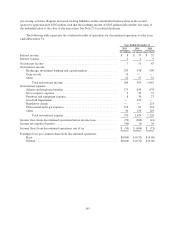
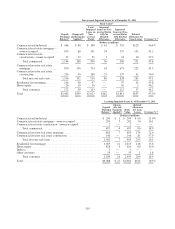
NOTE 6. ALLOWANCE FOR CREDIT LOSSES
The allowance for credit losses represents management’s estimate of credit losses inherent in the loan and
credit commitment portfolios as of year-end. The allowance for credit losses consists of two components: the
allowance for loan and lease losses and the reserve for unfunded credit commitments. Management’s assessment
of the appropriateness of the allowance for credit losses is based on a combination of both of these components.
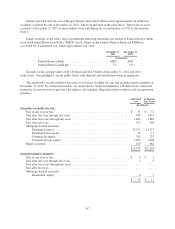
Regions determines its allowance for credit losses in accordance with applicable accounting literature as well as
regulatory guidance related to receivables and contingencies. Binding unfunded credit commitments include
items such as letters of credit, financial guarantees and binding unfunded loan commitments.
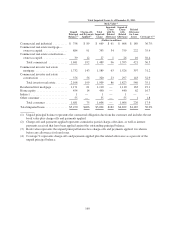
CALCULATION OF ALLOWANCE FOR CREDIT LOSSES
As part of the Company’s ongoing efforts to enhance the allowance calculation, and in response to
regulatory guidance, the home equity portfolio was segmented at a more granular level during the first quarter of
2012. Loss rates for home equity products are now developed based on lien position, status as a troubled debt
restructuring (“TDR”), geography, past due status, and refreshed FICO scores for non-past due loans. The
enhancement had the impact of reducing the component of the allowance for loan losses related to home equity
loans by an estimate of approximately $30 million.
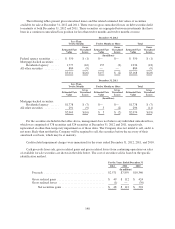
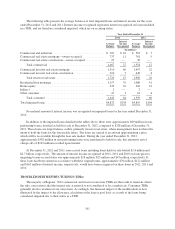
In addition to the home equity enhancement, in the second quarter of 2012, the Company refined the
methodology for estimation of the reserve for unfunded credit commitments. Before the change, the Company
based the reserve for unfunded credit commitments on an analysis of the overall probability of funding and
historical losses. Beginning with the second quarter of 2012, the reserve is based on an exposure at default
(“EAD”) multiplied by a probability of default (“PD”) multiplied by a loss-given default (“LGD”). The EAD is
estimated based on an analysis of historical funding patterns for defaulted loans in various categories. The PD
and LGD align with the statistically-calculated parameters used to calculate the allowance for loan losses for
various pools, which are based on credit quality indicators and product type. The methodology applies to
commercial and investor real estate credit commitments and standby letters of credit. The Company made this
change to enhance portfolio segmentation within the calculation of the reserve for unfunded credit commitments
and to improve overall consistency within the calculation of the allowance for credit losses. The change did not
have a material impact on the allowance for credit losses or the reserve for unfunded credit commitments.
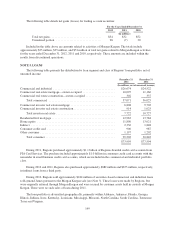
Except for the enhancements to home equity segmentation and to the reserve for unfunded credit
commitments described above, there were no changes during 2012 in methodology for the calculation of the
allowance for credit losses or policies for identification of non-accrual loans or for charge-offs. See Note 1 for a
detailed description of the Company’s methodology.
151