Regions Bank 2012 Annual Report Download - page 94
Download and view the complete annual report
Please find page 94 of the 2012 Regions Bank annual report below. You can navigate through the pages in the report by either clicking on the pages listed below, or by using the keyword search tool below to find specific information within the annual report.-
 1
1 -
2
-
3
-
4
-
5
-
6
-
7
-
8
-
9
-
10
-
11
-
12
-
13
-
14
-
15
-
16
-
17
-
18
-
19
-
20
-
21
-
22
-
23
-
24
-
25
-
26
-
27
-
28
-
29
-
30
-
31
-
32
-
33
-
34
-
35
-
36
-
37
-
38
-
39
-
40
-
41
-
42
-
43
-
44
-
45
-
46
-
47
-
48
-
49
-
50
-
51
-
52
-
53
-
54
-
55
-
56
-
57
-
58
-
59
-
60
-
61
-
62
-
63
-
64
-
65
-
66
-
67
-
68
-
69
-
70
-
71
-
72
-
73
-
74
-
75
-
76
-
77
-
78
-
79
-
80
-
81
-
82
-
83
-
 84
84 -
 85
85 -
 86
86 -
 87
87 -
 88
88 -
 89
89 -
 90
90 -
 91
91 -
 92
92 -
 93
93 -
 94
94 -
 95
95 -
 96
96 -
 97
97 -
 98
98 -
 99
99 -
 100
100 -
 101
101 -
 102
102 -
 103
103 -
 104
104 -
105
-
106
-
107
-
108
-
109
-
110
-
111
-
112
-
113
-
114
-
115
-
116
-
117
-
118
-
119
-
120
-
121
-
122
-
123
-
124
-
125
-
126
-
127
-
128
-
129
-
130
-
131
-
132
-
133
-
134
-
135
-
136
-
137
-
138
-
139
-
140
-
141
-
142
-
143
-
144
-
145
-
146
-
147
-
148
-
149
-
150
-
151
-
152
-
153
-
154
-
155
-
156
-
157
-
158
-
159
-
160
-
161
-
162
-
163
-
164
-
165
-
166
-
167
-
168
-
169
-
170
-
171
-
172
-
173
-
174
-
175
-
176
-
177
-
178
-
179
-
180
-
181
-
182
-
183
-
184
-
185
-
186
-
187
-
188
-
189
-
190
-
191
-
192
-
193
-
194
-
195
-
196
-
197
-
198
-
199
-
200
-
201
-
202
-
203
-
204
-
205
-
206
-
207
-
208
-
209
-
210
-
211
-
212
-
213
-
214
-
215
-
216
-
217
-
218
-
219
-
220
-
221
-
222
-
223
-
224
-
225
-
226
-
227
-
228
-
229
-
230
-
231
-
232
-
233
-
234
-
235
-
236
-
237
-
238
-
239
-
240
-
241
-
242
-
243
-
244
-
245
-
246
-
247
-
248
-
249
-
250
-
251
-
252
-
253
-
254
 |
 |

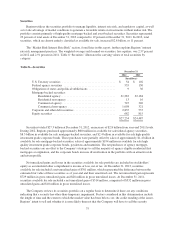
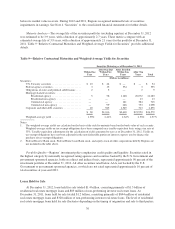
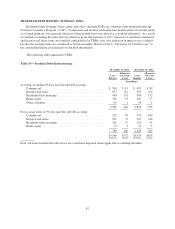
Table 11—Selected Loan Maturities
Loans Maturing as of December 31, 2012 (2)
Within
One Year
After One
But Within
Five Years
After
Five
Years Total
(In millions)
Commercial and industrial (1) ................................. $ 4,849 $16,312 $5,383 $26,544
Commercial real estate mortgage—owner-occupied ............... 1,932 5,272 2,891 10,095
Commercial real estate construction—owner occupied ............. 15 163 124 302
Total commercial ...................................... 6,796 21,747 8,398 36,941
Commercial investor real estate mortgage ....................... 3,340 3,052 416 6,808
Commercial investor real estate construction ..................... 479 399 36 914
Total investor real estate ..................................... 3,819 3,451 452 7,722
$10,615 $25,198 $8,850 $44,663
Predetermined
Rate
Variable
Rate
(In millions)
Due after one year but within five years ...................................... $5,476 $19,722
Due after five years ...................................................... 4,505 4,345
$9,981 $24,067
(1) Excludes $130 million of small business credit card accounts.
(2) Table 11 excludes residential first mortgage, home equity, indirect and other consumer loans.
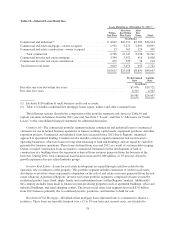
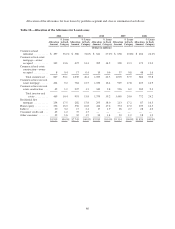
The following sections describe the composition of the portfolio segments and classes in Table 10 and
explain variations in balances from the 2011 year-end. See Note 5 “Loans” and Note 6 “Allowance for Credit
Losses” to the consolidated financial statements for additional discussion.
Commercial—The commercial portfolio segment includes commercial and industrial loans to commercial
customers for use in normal business operations to finance working capital needs, equipment purchases and other
expansion projects. Commercial and industrial loans have increased since 2011 due to Regions’ integrated
approach to specialized lending. Commercial also includes owner-occupied commercial real estate loans to
operating businesses, which are loans for long-term financing of land and buildings, and are repaid by cash flow
generated by business operations. These loans declined from year-end 2011 as a result of customer deleveraging.
Owner-occupied construction loans are made to commercial businesses for the development of land or
construction of a building where the repayment is derived from revenues generated from the business of the
borrower. During 2012, total commercial loan balances increased $1,046 million, or 3% percent, driven by
growth experienced in specialized industry groups.
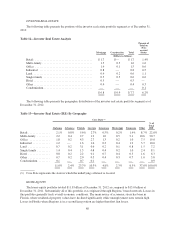
Investor Real Estate—Loans for real estate development are repaid through cash flow related to the
operation, sale or refinance of the property. This portfolio segment includes extensions of credit to real estate
developers or investors where repayment is dependent on the sale of real estate or income generated from the real
estate collateral. A portion of Regions’ investor real estate portfolio segment is comprised of loans secured by
residential product types (land, single-family and condominium loans) within Regions’ markets. Additionally,
this category includes loans made to finance income-producing properties such as apartment buildings, office and
industrial buildings, and retail shopping centers. The investor real estate loan segment decreased $3.0 billion
from 2011 balances primarily due to continued payoffs, paydowns, and transfers to held for sale.
Residential First Mortgage—Residential first mortgage loans represent loans to consumers to finance a
residence. These loans are typically financed over a 15 to 30 year term and, in most cases, are extended to
78