Regions Bank 2012 Annual Report Download - page 220
Download and view the complete annual report
Please find page 220 of the 2012 Regions Bank annual report below. You can navigate through the pages in the report by either clicking on the pages listed below, or by using the keyword search tool below to find specific information within the annual report.-
 1
1 -
2
-
3
-
4
-
5
-
6
-
7
-
8
-
9
-
10
-
11
-
12
-
13
-
14
-
15
-
16
-
17
-
18
-
19
-
20
-
21
-
22
-
23
-
24
-
25
-
26
-
27
-
28
-
29
-
30
-
31
-
32
-
33
-
34
-
35
-
36
-
37
-
38
-
39
-
40
-
41
-
42
-
43
-
44
-
45
-
46
-
47
-
48
-
49
-
50
-
51
-
52
-
53
-
54
-
55
-
56
-
57
-
58
-
59
-
60
-
61
-
62
-
63
-
64
-
65
-
66
-
67
-
68
-
69
-
70
-
71
-
72
-
73
-
74
-
75
-
76
-
77
-
78
-
79
-
80
-
81
-
82
-
83
-
84
-
85
-
86
-
87
-
88
-
89
-
90
-
91
-
92
-
93
-
94
-
95
-
96
-
97
-
98
-
99
-
100
-
101
-
102
-
103
-
104
-
105
-
106
-
107
-
108
-
109
-
110
-
111
-
112
-
113
-
114
-
115
-
116
-
117
-
118
-
119
-
120
-
121
-
122
-
123
-
124
-
125
-
126
-
127
-
128
-
129
-
130
-
131
-
132
-
133
-
134
-
135
-
136
-
137
-
138
-
139
-
140
-
141
-
142
-
143
-
144
-
145
-
146
-
147
-
148
-
149
-
150
-
151
-
152
-
153
-
154
-
155
-
156
-
157
-
158
-
159
-
160
-
161
-
162
-
163
-
164
-
165
-
166
-
167
-
168
-
169
-
170
-
171
-
172
-
173
-
174
-
175
-
176
-
177
-
178
-
179
-
180
-
181
-
182
-
183
-
184
-
185
-
186
-
187
-
188
-
189
-
190
-
191
-
192
-
193
-
194
-
195
-
196
-
197
-
198
-
199
-
200
-
201
-
202
-
203
-
204
-
205
-
206
-
207
-
208
-
209
-
 210
210 -
 211
211 -
 212
212 -
 213
213 -
 214
214 -
 215
215 -
 216
216 -
 217
217 -
 218
218 -
 219
219 -
 220
220 -
 221
221 -
 222
222 -
 223
223 -
 224
224 -
 225
225 -
 226
226 -
 227
227 -
 228
228 -
 229
229 -
 230
230 -
231
-
232
-
233
-
234
-
235
-
236
-
237
-
238
-
239
-
240
-
241
-
242
-
243
-
244
-
245
-
246
-
247
-
248
-
249
-
250
-
251
-
252
-
253
-
254
 |
 |

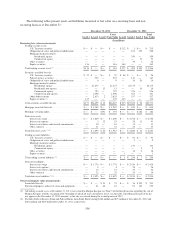
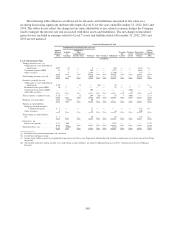
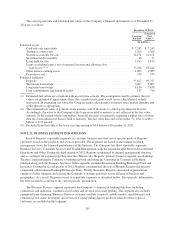
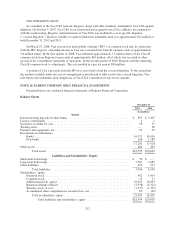
The carrying amounts and estimated fair values as well as the level within the fair value hierarchy, of the
Company’s financial instruments as of December 31, 2012 are as follows:
December 31, 2012
Carrying Estimated
Amount Fair Value (1) Level 1 Level 2 Level 3
(In millions)
Financial assets:
Cash and cash equivalents ...................... $ 5,489 $ 5,489 $5,489 $ — $ —
Trading account assets ......................... 116 116 116 — —
Securities available for sale ..................... 27,244 27,244 177 27,052 15
Securities held to maturity ...................... 10 11 2 9 —
Loans held for sale ........................... 1,383 1,383 — 1,282 101
Loans (excluding leases), net of unearned income and
allowance for loan losses (2), (3) ................ 70,574 63,961 — — 63,961
Other interest-earning assets .................... 900 900 — 900 —
Derivatives, net .............................. 90 90 — 68 22
Financial liabilities:
Deposits .................................... 95,474 95,528 — 95,528 —
Short-term borrowings ........................ 1,574 1,574 — 1,574 —
Long-term borrowings ......................... 5,861 6,138 1,037 — 5,101
Loan commitments and letters of credit ........... 121 667 — — 667
Indemnification obligation ..................... 345 329 — — 329
(1) Estimated fair values are consistent with an exit price concept. The assumptions used to estimate the fair
values are intended to approximate those that a market participant would use in a hypothetical orderly
transaction. In estimating fair value, the Company makes adjustments for interest rates, market liquidity and
credit spreads as appropriate.
(2) The estimated fair value of portfolio loans assumes sale of the loans to a third-party financial investor.
Accordingly, the value to the Company if the loans were held to maturity is not reflected in the fair value
estimate. In the current whole loan market, financial investors are generally requiring a higher rate of return
than the return inherent in loans if held to maturity. The fair value discount at December 31, 2012 was $6.6
billion or 9.4 percent.
(3) Excluded from this table is the lease carrying amount of $1.5 billion at December 31, 2012.
204