Regions Bank 2012 Annual Report Download - page 115
Download and view the complete annual report
Please find page 115 of the 2012 Regions Bank annual report below. You can navigate through the pages in the report by either clicking on the pages listed below, or by using the keyword search tool below to find specific information within the annual report.-
 1
1 -
2
-
3
-
4
-
5
-
6
-
7
-
8
-
9
-
10
-
11
-
12
-
13
-
14
-
15
-
16
-
17
-
18
-
19
-
20
-
21
-
22
-
23
-
24
-
25
-
26
-
27
-
28
-
29
-
30
-
31
-
32
-
33
-
34
-
35
-
36
-
37
-
38
-
39
-
40
-
41
-
42
-
43
-
44
-
45
-
46
-
47
-
48
-
49
-
50
-
51
-
52
-
53
-
54
-
55
-
56
-
57
-
58
-
59
-
60
-
61
-
62
-
63
-
64
-
65
-
66
-
67
-
68
-
69
-
70
-
71
-
72
-
73
-
74
-
75
-
76
-
77
-
78
-
79
-
80
-
81
-
82
-
83
-
84
-
85
-
86
-
87
-
88
-
89
-
90
-
91
-
92
-
93
-
94
-
95
-
96
-
97
-
98
-
99
-
100
-
101
-
102
-
103
-
104
-
 105
105 -
 106
106 -
 107
107 -
 108
108 -
 109
109 -
 110
110 -
 111
111 -
 112
112 -
 113
113 -
 114
114 -
 115
115 -
 116
116 -
 117
117 -
 118
118 -
 119
119 -
 120
120 -
 121
121 -
 122
122 -
 123
123 -
 124
124 -
 125
125 -
126
-
127
-
128
-
129
-
130
-
131
-
132
-
133
-
134
-
135
-
136
-
137
-
138
-
139
-
140
-
141
-
142
-
143
-
144
-
145
-
146
-
147
-
148
-
149
-
150
-
151
-
152
-
153
-
154
-
155
-
156
-
157
-
158
-
159
-
160
-
161
-
162
-
163
-
164
-
165
-
166
-
167
-
168
-
169
-
170
-
171
-
172
-
173
-
174
-
175
-
176
-
177
-
178
-
179
-
180
-
181
-
182
-
183
-
184
-
185
-
186
-
187
-
188
-
189
-
190
-
191
-
192
-
193
-
194
-
195
-
196
-
197
-
198
-
199
-
200
-
201
-
202
-
203
-
204
-
205
-
206
-
207
-
208
-
209
-
210
-
211
-
212
-
213
-
214
-
215
-
216
-
217
-
218
-
219
-
220
-
221
-
222
-
223
-
224
-
225
-
226
-
227
-
228
-
229
-
230
-
231
-
232
-
233
-
234
-
235
-
236
-
237
-
238
-
239
-
240
-
241
-
242
-
243
-
244
-
245
-
246
-
247
-
248
-
249
-
250
-
251
-
252
-
253
-
254
 |
 |

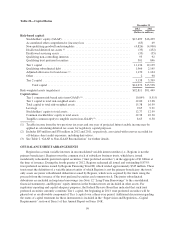
Table 28—Capital Ratios
December 31
2012 2011
(Dollars in millions)
Risk-based capital:
Stockholders’ equity (GAAP) .............................................. $15,499 $16,499
Accumulated other comprehensive (income) loss .............................. (65) 69
Non-qualifying goodwill and intangibles ..................................... (4,826) (4,900)
Disallowed deferred tax assets (1) ........................................... (35) (432)
Disallowed servicing assets ................................................ (33) (35)
Qualifying non-controlling interests ......................................... 93 92
Qualifying trust preferred securities ......................................... 501 846
Tier 1 capital ........................................................... 11,134 12,139
Qualifying subordinated debt .............................................. 1,966 2,145
Adjusted allowance for loan losses (2) ........................................ 1,170 1,164
Other ................................................................. 2 90
Tier 2 capital ........................................................... 3,138 3,399
Total capital ........................................................ $14,272 $15,538
Risk-weighted assets (regulatory) ............................................... $92,811 $91,449
Capital ratios:
Tier 1 common risk-based ratio (non-GAAP) (3) ................................ 10.84% 8.51%
Tier 1 capital to total risk-weighted assets .................................... 12.00 13.28
Total capital to total risk-weighted assets ..................................... 15.38 16.99
Leverage .............................................................. 9.65 9.91
Stockholders’ equity to total assets .......................................... 12.77 12.99
Common stockholders’ equity to total assets .................................. 12.38 10.30
Tangible common equity to tangible assets (non-GAAP) (3) ....................... 8.63 6.58
(1) Taxable income from the two previous tax years and one year of projected future taxable income may be
applied in calculating deferred tax assets for regulatory capital purposes.
(2) Includes $83 million and $78 million in 2012 and 2011, respectively, associated with reserves recorded for
off-balance sheet credit exposures, including derivatives.
(3) See Table 2 “GAAP to Non-GAAP Reconciliation” for further details.
OFF-BALANCE SHEET ARRANGEMENTS
Regions has certain variable interests in unconsolidated variable interest entities (i.e., Regions is not the
primary beneficiary). Regions owns the common stock of subsidiary business trusts, which have issued
mandatorily redeemable preferred capital securities (“trust preferred securities”) in the aggregate of $1 billion at
the time of issuance. During the fourth quarter of 2012, Regions redeemed all issued and outstanding 8.875%
trust preferred securities issued by Regions Financing Trust III, which totaled approximately $345 million. These
trusts meet the definition of a variable interest entity of which Regions is not the primary beneficiary; the trusts’
only assets are junior subordinated debentures issued by Regions, which were acquired by the trusts using the
proceeds from the issuance of the trust preferred securities and common stock. The junior subordinated
debentures are included in long-term borrowings (see Note 12 “Long-Term Borrowings” to the consolidated
financial statements), and Regions’ equity interests in the business trusts are included in other assets. For
regulatory reporting and capital adequacy purposes, the Federal Reserve Board has indicated that such trust
preferred securities currently constitute Tier 1 capital, but beginning in 2013, trust preferred securities will be
phased out as an allowable component of Tier 1 capital over a three-year period. Additional discussion regarding
the status of capital treatment for these instruments is included in the “Supervision and Regulation—Capital
Requirements” section of Item 1 of this Annual Report on Form 10-K.
99