Regions Bank 2012 Annual Report Download - page 210
Download and view the complete annual report
Please find page 210 of the 2012 Regions Bank annual report below. You can navigate through the pages in the report by either clicking on the pages listed below, or by using the keyword search tool below to find specific information within the annual report.-
 1
1 -
2
-
3
-
4
-
5
-
6
-
7
-
8
-
9
-
10
-
11
-
12
-
13
-
14
-
15
-
16
-
17
-
18
-
19
-
20
-
21
-
22
-
23
-
24
-
25
-
26
-
27
-
28
-
29
-
30
-
31
-
32
-
33
-
34
-
35
-
36
-
37
-
38
-
39
-
40
-
41
-
42
-
43
-
44
-
45
-
46
-
47
-
48
-
49
-
50
-
51
-
52
-
53
-
54
-
55
-
56
-
57
-
58
-
59
-
60
-
61
-
62
-
63
-
64
-
65
-
66
-
67
-
68
-
69
-
70
-
71
-
72
-
73
-
74
-
75
-
76
-
77
-
78
-
79
-
80
-
81
-
82
-
83
-
84
-
85
-
86
-
87
-
88
-
89
-
90
-
91
-
92
-
93
-
94
-
95
-
96
-
97
-
98
-
99
-
100
-
101
-
102
-
103
-
104
-
105
-
106
-
107
-
108
-
109
-
110
-
111
-
112
-
113
-
114
-
115
-
116
-
117
-
118
-
119
-
120
-
121
-
122
-
123
-
124
-
125
-
126
-
127
-
128
-
129
-
130
-
131
-
132
-
133
-
134
-
135
-
136
-
137
-
138
-
139
-
140
-
141
-
142
-
143
-
144
-
145
-
146
-
147
-
148
-
149
-
150
-
151
-
152
-
153
-
154
-
155
-
156
-
157
-
158
-
159
-
160
-
161
-
162
-
163
-
164
-
165
-
166
-
167
-
168
-
169
-
170
-
171
-
172
-
173
-
174
-
175
-
176
-
177
-
178
-
179
-
180
-
181
-
182
-
183
-
184
-
185
-
186
-
187
-
188
-
189
-
190
-
191
-
192
-
193
-
194
-
195
-
196
-
197
-
198
-
199
-
 200
200 -
 201
201 -
 202
202 -
 203
203 -
 204
204 -
 205
205 -
 206
206 -
 207
207 -
 208
208 -
 209
209 -
 210
210 -
 211
211 -
 212
212 -
 213
213 -
 214
214 -
 215
215 -
 216
216 -
 217
217 -
 218
218 -
 219
219 -
 220
220 -
221
-
222
-
223
-
224
-
225
-
226
-
227
-
228
-
229
-
230
-
231
-
232
-
233
-
234
-
235
-
236
-
237
-
238
-
239
-
240
-
241
-
242
-
243
-
244
-
245
-
246
-
247
-
248
-
249
-
250
-
251
-
252
-
253
-
254
 |
 |
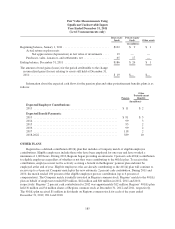
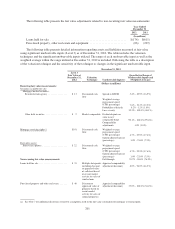
CREDIT DERIVATIVES
Regions has both bought and sold credit protection in the form of participations on interest rate swaps (swap
participations). These swap participations, which meet the definition of credit derivatives, were entered into in
the ordinary course of business to serve the credit needs of customers. Credit derivatives, whereby Regions has
purchased credit protection, entitle Regions to receive a payment from the counterparty when the customer fails
to make payment on any amounts due to Regions upon early termination of the swap transaction and have
maturities between 2013 and 2017. Credit derivatives whereby Regions has sold credit protection have maturities
between 2013 and 2018. For contracts where Regions sold credit protection, Regions would be required to make
payment to the counterparty when the customer fails to make payment on any amounts due to the counterparty
upon early termination of the swap transaction. Regions bases the current status of the prepayment/performance
risk on bought and sold credit derivatives on recently issued internal risk ratings consistent with the risk
management practices of unfunded commitments.
Regions’ maximum potential amount of future payments under these contracts as of December 31, 2012 is
approximately $33 million. This scenario would only occur if variable interest rates were at zero percent and all
counterparties defaulted with zero recovery. The fair value of sold protection at December 31, 2012 was
immaterial. In transactions where Regions has sold credit protection, recourse to collateral associated with the
original swap transaction is available to offset some or all of Regions’ obligation.
CONTINGENT FEATURES
Certain of Regions’ derivative instrument contracts with broker-dealers contain provisions allowing those
broker-dealers to terminate the contracts in the event that Regions’ and/or Regions Bank’s credit rating falls
below specified ratings from certain major credit rating agencies. During the fourth quarter of 2010, Regions and
Regions Bank experienced ratings downgrades from major credit rating agencies such that certain ratings for
Regions and Regions Bank were below investment grade. As a result of these ratings downgrades, certain of
Regions Bank’s broker-dealer counterparties could have terminated these contracts at their discretion. In lieu of
terminating the contracts, Regions Bank and certain of its broker-dealer counterparties amended the contracts
such that Regions Bank was required to post additional collateral in the cumulative amount of $195 million as of
December 31, 2010. As of December 31, 2012, the additional collateral posted was $185 million. During 2012,
both Moody’s Investor Service (“Moody’s”) and Standard & Poor’s (“S&P”) upgraded certain credit ratings for
both Regions and Regions Bank. In 2013, as a result of the ratings upgrades that occurred during 2012, some of
this additional collateral has begun to be returned to Regions.
Some of these contracts with broker-dealers still contain credit-related termination provisions and/or credit-
related provisions regarding the posting of collateral. At December 31, 2012, the net fair value of such contracts
containing credit-related termination provisions that were in a liability position was $419 million, for which
Regions had posted collateral of $560 million. At December 31, 2012, the net fair value of contracts that do not
contain credit-related termination provisions that were in a liability position was $262 million for which Regions
had posted collateral of $267 million. Other derivative contracts with broker-dealers do not contain any credit-
related provisions. These counterparties require complete overnight collateralization.
The aggregate fair value of all derivative instruments with any credit-risk-related contingent features that
were in a liability position on December 31, 2012 and 2011, was $499 million and $425 million, respectively, for
which Regions had posted collateral of $641 million and $531 million, respectively, in the normal course of
business.
194