Regions Bank 2012 Annual Report Download - page 163
Download and view the complete annual report
Please find page 163 of the 2012 Regions Bank annual report below. You can navigate through the pages in the report by either clicking on the pages listed below, or by using the keyword search tool below to find specific information within the annual report.-
 1
1 -
2
-
3
-
4
-
5
-
6
-
7
-
8
-
9
-
10
-
11
-
12
-
13
-
14
-
15
-
16
-
17
-
18
-
19
-
20
-
21
-
22
-
23
-
24
-
25
-
26
-
27
-
28
-
29
-
30
-
31
-
32
-
33
-
34
-
35
-
36
-
37
-
38
-
39
-
40
-
41
-
42
-
43
-
44
-
45
-
46
-
47
-
48
-
49
-
50
-
51
-
52
-
53
-
54
-
55
-
56
-
57
-
58
-
59
-
60
-
61
-
62
-
63
-
64
-
65
-
66
-
67
-
68
-
69
-
70
-
71
-
72
-
73
-
74
-
75
-
76
-
77
-
78
-
79
-
80
-
81
-
82
-
83
-
84
-
85
-
86
-
87
-
88
-
89
-
90
-
91
-
92
-
93
-
94
-
95
-
96
-
97
-
98
-
99
-
100
-
101
-
102
-
103
-
104
-
105
-
106
-
107
-
108
-
109
-
110
-
111
-
112
-
113
-
114
-
115
-
116
-
117
-
118
-
119
-
120
-
121
-
122
-
123
-
124
-
125
-
126
-
127
-
128
-
129
-
130
-
131
-
132
-
133
-
134
-
135
-
136
-
137
-
138
-
139
-
140
-
141
-
142
-
143
-
144
-
145
-
146
-
147
-
148
-
149
-
150
-
151
-
152
-
 153
153 -
 154
154 -
 155
155 -
 156
156 -
 157
157 -
 158
158 -
 159
159 -
 160
160 -
 161
161 -
 162
162 -
 163
163 -
 164
164 -
 165
165 -
 166
166 -
 167
167 -
 168
168 -
 169
169 -
 170
170 -
 171
171 -
 172
172 -
 173
173 -
174
-
175
-
176
-
177
-
178
-
179
-
180
-
181
-
182
-
183
-
184
-
185
-
186
-
187
-
188
-
189
-
190
-
191
-
192
-
193
-
194
-
195
-
196
-
197
-
198
-
199
-
200
-
201
-
202
-
203
-
204
-
205
-
206
-
207
-
208
-
209
-
210
-
211
-
212
-
213
-
214
-
215
-
216
-
217
-
218
-
219
-
220
-
221
-
222
-
223
-
224
-
225
-
226
-
227
-
228
-
229
-
230
-
231
-
232
-
233
-
234
-
235
-
236
-
237
-
238
-
239
-
240
-
241
-
242
-
243
-
244
-
245
-
246
-
247
-
248
-
249
-
250
-
251
-
252
-
253
-
254
 |
 |

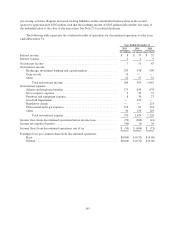
Entities included with the sale of Morgan Keegan and related affiliates had approximately $2 million in
securities available for sale at December 31, 2011, which are included in the table above. There were no such
securities at December 31, 2012 as these entities were sold during the second quarter of 2012 as discussed in
Note 3.
Equity securities in the tables above included the following amortized cost related to Federal Reserve Bank
stock and Federal Home Loan Bank (“FHLB”) stock. Shares in the Federal Reserve Bank and FHLB are
accounted for at amortized cost, which approximates fair value.
December 31
2012
December 31
2011
(In millions)
Federal Reserve Bank ......................... $484 $481
Federal Home Loan Bank ...................... 73 219
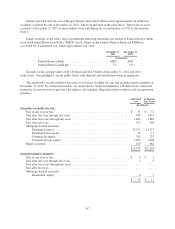
Securities with carrying values of $11.8 billion and $14.3 billion at December 31, 2012 and 2011,
respectively, were pledged to secure public funds, trust deposits and certain borrowing arrangements.
The amortized cost and estimated fair value of securities available for sale and securities held to maturity at
December 31, 2012, by contractual maturity, are shown below. Expected maturities will differ from contractual
maturities because borrowers may have the right to call or prepay obligations with or without call or prepayment
penalties.
Amortized
Cost
Estimated
Fair Value
(In millions)
Securities available for sale:
Due in one year or less .................................................. $ 31 $ 31
Due after one year through five years ...................................... 985 1,007
Due after five years through ten years ...................................... 1,843 1,883
Due after ten years ..................................................... 512 528
Mortgage-backed securities:
Residential agency ................................................. 20,721 21,277
Residential non-agency ............................................. 12 13
Commercial agency ................................................ 705 725
Commercial non-agency ............................................ 1,055 1,098
Equity securities ....................................................... 679 682
$26,543 $27,244
Securities held to maturity:
Due in one year or less .................................................. $ 2 $ 2
Due after one year through five years ...................................... 2 2
Due after five years through ten years ...................................... — —
Due after ten years ..................................................... — —
Mortgage-backed securities:
Residential agency ................................................. 6 7
$10$11
147