Regions Bank 2012 Annual Report Download - page 212
Download and view the complete annual report
Please find page 212 of the 2012 Regions Bank annual report below. You can navigate through the pages in the report by either clicking on the pages listed below, or by using the keyword search tool below to find specific information within the annual report.-
 1
1 -
2
-
3
-
4
-
5
-
6
-
7
-
8
-
9
-
10
-
11
-
12
-
13
-
14
-
15
-
16
-
17
-
18
-
19
-
20
-
21
-
22
-
23
-
24
-
25
-
26
-
27
-
28
-
29
-
30
-
31
-
32
-
33
-
34
-
35
-
36
-
37
-
38
-
39
-
40
-
41
-
42
-
43
-
44
-
45
-
46
-
47
-
48
-
49
-
50
-
51
-
52
-
53
-
54
-
55
-
56
-
57
-
58
-
59
-
60
-
61
-
62
-
63
-
64
-
65
-
66
-
67
-
68
-
69
-
70
-
71
-
72
-
73
-
74
-
75
-
76
-
77
-
78
-
79
-
80
-
81
-
82
-
83
-
84
-
85
-
86
-
87
-
88
-
89
-
90
-
91
-
92
-
93
-
94
-
95
-
96
-
97
-
98
-
99
-
100
-
101
-
102
-
103
-
104
-
105
-
106
-
107
-
108
-
109
-
110
-
111
-
112
-
113
-
114
-
115
-
116
-
117
-
118
-
119
-
120
-
121
-
122
-
123
-
124
-
125
-
126
-
127
-
128
-
129
-
130
-
131
-
132
-
133
-
134
-
135
-
136
-
137
-
138
-
139
-
140
-
141
-
142
-
143
-
144
-
145
-
146
-
147
-
148
-
149
-
150
-
151
-
152
-
153
-
154
-
155
-
156
-
157
-
158
-
159
-
160
-
161
-
162
-
163
-
164
-
165
-
166
-
167
-
168
-
169
-
170
-
171
-
172
-
173
-
174
-
175
-
176
-
177
-
178
-
179
-
180
-
181
-
182
-
183
-
184
-
185
-
186
-
187
-
188
-
189
-
190
-
191
-
192
-
193
-
194
-
195
-
196
-
197
-
198
-
199
-
200
-
201
-
 202
202 -
 203
203 -
 204
204 -
 205
205 -
 206
206 -
 207
207 -
 208
208 -
 209
209 -
 210
210 -
 211
211 -
 212
212 -
 213
213 -
 214
214 -
 215
215 -
 216
216 -
 217
217 -
 218
218 -
 219
219 -
 220
220 -
 221
221 -
 222
222 -
223
-
224
-
225
-
226
-
227
-
228
-
229
-
230
-
231
-
232
-
233
-
234
-
235
-
236
-
237
-
238
-
239
-
240
-
241
-
242
-
243
-
244
-
245
-
246
-
247
-
248
-
249
-
250
-
251
-
252
-
253
-
254
 |
 |

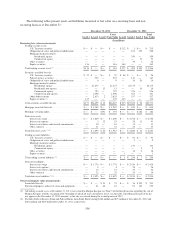
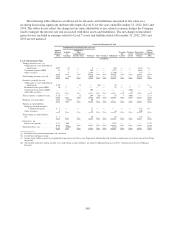
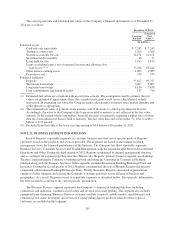
The following tables present assets and liabilities measured at fair value on a recurring basis and non-
recurring basis as of December 31:
December 31, 2012 December 31, 2011
Level 1 Level 2 Level 3
Total
Fair Value Level 1 Level 2 Level 3
Total
Fair Value
(In millions)
Recurring fair value measurements
Trading account assets
U.S. Treasury securities ........................ $— $ — $— $ — $212 $ 3 $— $ 215
Obligations of states and political subdivisions ...... — — — — — 101 139 240
Mortgage-backed securities:
Residential agency ........................ — — — — — 359 — 359
Commercial agency ........................ — — — — — — 51 51
Other securities ............................... — — — — — 35 1 36
Equity securities .............................. 116 — — 116 365 — — 365
Total trading account assets (1) ....................... $116 $ — $— $ 116 $577 $ 498 $191 $ 1,266
Securities available for sale
U.S. Treasury securities ........................ $ 52 $ — $— $ 52 $ 98 $ — $— $ 98
Federal agency securities ....................... — 553 — 553 — 147 — 147
Obligations of states and political subdivisions ...... — 9 — 9 — 16 20 36
Mortgage-backed securities:
Residential agency ........................ — 21,277 — 21,277 — 22,175 — 22,175
Residential non-agency ..................... — — 13 13 — — 16 16
Commercial agency ........................ — 725 — 725 — 326 — 326
Commercial non-agency .................... — 1,098 — 1,098 — 321 — 321
Other debt securities ........................... — 2,833 2 2,835 — 537 — 537
Equity securities (2) ............................ 125 — — 125 115 — — 115
Total securities available for sale ..................... $177 $26,495 $ 15 $26,687 $ 213 $23,522 $ 36 $23,771
Mortgage loans held for sale ......................... $— $ 1,282 $— $ 1,282 $ — $ 844 $ — $ 844
Mortgage servicing rights ........................... $— $ — $191 $ 191 $ — $ — $ 182 $ 182
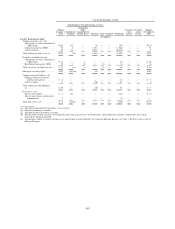
Derivative assets
Interest rate swaps ............................. $— $ 1,849 $— $ 1,849 $ — $ 2,758 $ — $ 2,758
Interest rate options ............................ — 3 22 25 — 28 13 41
Interest rate futures and forward commitments ...... — 10 — 10 — 11 — 11
Other contracts ............................... — 31 — 31 — 43 — 43
Total derivative assets (3) (4) .......................... $— $ 1,893 $ 22 $ 1,915 $ — $ 2,840 $ 13 $ 2,853
Trading account liabilities
U.S. Treasury securities ........................ $— $ — $— $ — $— $ 97 $— $ 97
Obligations of states and political subdivisions ...... — — — — — 2 — 2
Mortgage-backed securities:
Residential agency ........................ — — — — — 133 — 133
Commercial agency ........................ — — — — — — 5 5
Other securities ............................... — — — — — 16 2 18
Equity securities .............................. — — — — 1 — — 1
Total trading account liabilities (5) ..................... $— $ — $— $ — $ 1 $ 248 $ 7 $ 256
Derivative liabilities
Interest rate swaps ............................. $— $ 1,776 $— $ 1,776 $ — $ 2,416 $ — $ 2,416
Interest rate options ............................ — 4 — 4 — 28 — 28
Interest rate futures and forward commitments ...... — 13 — 13 — 34 — 34
Other contracts ............................... — 32 — 32 — 36 — 36
Total derivative liabilities (3) (4) ....................... $— $ 1,825 $— $ 1,825 $ — $ 2,514 $ — $ 2,514
Non-recurring fair value measurements
Loans held for sale ................................ $— $ — $ 51 $ 51 $— $ 36 $195 $ 231
Foreclosed property, other real estate and equipment ...... — 41 40 81 — 91 162 253
(1) All trading account assets at December 31, 2011 were related to Morgan Keegan (see Note 3 for further discussion regarding the sale of
Morgan Keegan) with the exception of $178 million of which all were classified as Level 1 in the table. The Morgan Keegan items do
not appear in the December 31, 2012 amounts, as the sale was closed during the second quarter of 2012.
(2) Excludes Federal Reserve Bank and Federal Home Loan Bank Stock totaling $484 million and $73 million at December 31, 2012 and
$481 million and $219 million December 31, 2011, respectively.
196