Regions Bank 2012 Annual Report Download - page 168
Download and view the complete annual report
Please find page 168 of the 2012 Regions Bank annual report below. You can navigate through the pages in the report by either clicking on the pages listed below, or by using the keyword search tool below to find specific information within the annual report.-
 1
1 -
2
-
3
-
4
-
5
-
6
-
7
-
8
-
9
-
10
-
11
-
12
-
13
-
14
-
15
-
16
-
17
-
18
-
19
-
20
-
21
-
22
-
23
-
24
-
25
-
26
-
27
-
28
-
29
-
30
-
31
-
32
-
33
-
34
-
35
-
36
-
37
-
38
-
39
-
40
-
41
-
42
-
43
-
44
-
45
-
46
-
47
-
48
-
49
-
50
-
51
-
52
-
53
-
54
-
55
-
56
-
57
-
58
-
59
-
60
-
61
-
62
-
63
-
64
-
65
-
66
-
67
-
68
-
69
-
70
-
71
-
72
-
73
-
74
-
75
-
76
-
77
-
78
-
79
-
80
-
81
-
82
-
83
-
84
-
85
-
86
-
87
-
88
-
89
-
90
-
91
-
92
-
93
-
94
-
95
-
96
-
97
-
98
-
99
-
100
-
101
-
102
-
103
-
104
-
105
-
106
-
107
-
108
-
109
-
110
-
111
-
112
-
113
-
114
-
115
-
116
-
117
-
118
-
119
-
120
-
121
-
122
-
123
-
124
-
125
-
126
-
127
-
128
-
129
-
130
-
131
-
132
-
133
-
134
-
135
-
136
-
137
-
138
-
139
-
140
-
141
-
142
-
143
-
144
-
145
-
146
-
147
-
148
-
149
-
150
-
151
-
152
-
153
-
154
-
155
-
156
-
157
-
 158
158 -
 159
159 -
 160
160 -
 161
161 -
 162
162 -
 163
163 -
 164
164 -
 165
165 -
 166
166 -
 167
167 -
 168
168 -
 169
169 -
 170
170 -
 171
171 -
 172
172 -
 173
173 -
 174
174 -
 175
175 -
 176
176 -
 177
177 -
 178
178 -
179
-
180
-
181
-
182
-
183
-
184
-
185
-
186
-
187
-
188
-
189
-
190
-
191
-
192
-
193
-
194
-
195
-
196
-
197
-
198
-
199
-
200
-
201
-
202
-
203
-
204
-
205
-
206
-
207
-
208
-
209
-
210
-
211
-
212
-
213
-
214
-
215
-
216
-
217
-
218
-
219
-
220
-
221
-
222
-
223
-
224
-
225
-
226
-
227
-
228
-
229
-
230
-
231
-
232
-
233
-
234
-
235
-
236
-
237
-
238
-
239
-
240
-
241
-
242
-
243
-
244
-
245
-
246
-
247
-
248
-
249
-
250
-
251
-
252
-
253
-
254
 |
 |

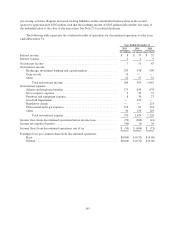
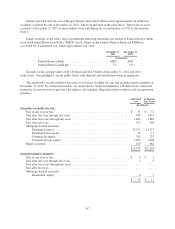
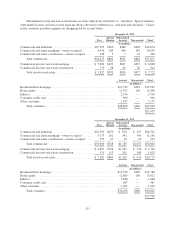
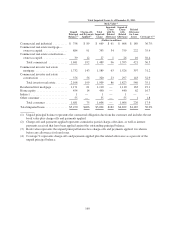
ROLLFORWARD OF ALLOWANCE FOR CREDIT LOSSES
The following tables present an analysis of the allowance for credit losses by portfolio segment for the years
ended December 31, 2012 and December 31, 2011. The total allowance for credit losses is then disaggregated to
detail the amounts derived through individual evaluation and the amounts calculated through collective
evaluation. The allowance for loan losses related to individually evaluated loans includes reserves for non-
accrual loans and leases equal to or greater than $2.5 million. The allowance for loan losses related to
collectively evaluated loans includes the remainder of the portfolio.
2012
Commercial
Investor Real
Estate Consumer Total
(In millions)
Allowance for loan losses, January 1, 2012 ................... $ 1,030 $ 991 $ 724 $ 2,745
Provision (credit) for loan losses ........................... 144 (295) 364 213
Loan losses:
Charge-offs ........................................ (404) (272) (547) (1,223)
Recoveries ........................................ 77 45 62 184
Net loan losses ..................................... (327) (227) (485) (1,039)
Allowance for loan losses, December 31, 2012 ................ 847 469 603 1,919
Reserve for unfunded credit commitments, January 1, 2012 ...... 30 26 22 78
Provision (credit) for unfunded credit commitments ........ 39 (16) (18) 5
Reserve for unfunded credit commitments, December 31, 2012 . . . 69 10 4 83
Allowance for credit losses, December 31, 2012 ............... $ 916 $ 479 $ 607 $ 2,002
Portion of ending allowance for loan losses:
Individually evaluated for impairment ................... $ 96 $ 73 $ — $ 169
Collectively evaluated for impairment ................... 751 396 603 1,750
Total allowance for loan losses ............................ $ 847 $ 469 $ 603 $ 1,919
Portion of loan portfolio ending balance:
Individually evaluated for impairment ................... $ 432 $ 315 $ 2 $ 749
Collectively evaluated for impairment ................... 36,639 7,407 29,200 73,246
Total loans evaluated for impairment ........................ $37,071 $7,722 $29,202 $73,995
152