Regions Bank 2012 Annual Report Download - page 64
Download and view the complete annual report
Please find page 64 of the 2012 Regions Bank annual report below. You can navigate through the pages in the report by either clicking on the pages listed below, or by using the keyword search tool below to find specific information within the annual report.-
 1
1 -
2
-
3
-
4
-
5
-
6
-
7
-
8
-
9
-
10
-
11
-
12
-
13
-
14
-
15
-
16
-
17
-
18
-
19
-
20
-
21
-
22
-
23
-
24
-
25
-
26
-
27
-
28
-
29
-
30
-
31
-
32
-
33
-
34
-
35
-
36
-
37
-
38
-
39
-
40
-
41
-
42
-
43
-
44
-
45
-
46
-
47
-
48
-
49
-
50
-
51
-
52
-
53
-
 54
54 -
 55
55 -
 56
56 -
 57
57 -
 58
58 -
 59
59 -
 60
60 -
 61
61 -
 62
62 -
 63
63 -
 64
64 -
 65
65 -
 66
66 -
 67
67 -
 68
68 -
 69
69 -
 70
70 -
 71
71 -
 72
72 -
 73
73 -
 74
74 -
75
-
76
-
77
-
78
-
79
-
80
-
81
-
82
-
83
-
84
-
85
-
86
-
87
-
88
-
89
-
90
-
91
-
92
-
93
-
94
-
95
-
96
-
97
-
98
-
99
-
100
-
101
-
102
-
103
-
104
-
105
-
106
-
107
-
108
-
109
-
110
-
111
-
112
-
113
-
114
-
115
-
116
-
117
-
118
-
119
-
120
-
121
-
122
-
123
-
124
-
125
-
126
-
127
-
128
-
129
-
130
-
131
-
132
-
133
-
134
-
135
-
136
-
137
-
138
-
139
-
140
-
141
-
142
-
143
-
144
-
145
-
146
-
147
-
148
-
149
-
150
-
151
-
152
-
153
-
154
-
155
-
156
-
157
-
158
-
159
-
160
-
161
-
162
-
163
-
164
-
165
-
166
-
167
-
168
-
169
-
170
-
171
-
172
-
173
-
174
-
175
-
176
-
177
-
178
-
179
-
180
-
181
-
182
-
183
-
184
-
185
-
186
-
187
-
188
-
189
-
190
-
191
-
192
-
193
-
194
-
195
-
196
-
197
-
198
-
199
-
200
-
201
-
202
-
203
-
204
-
205
-
206
-
207
-
208
-
209
-
210
-
211
-
212
-
213
-
214
-
215
-
216
-
217
-
218
-
219
-
220
-
221
-
222
-
223
-
224
-
225
-
226
-
227
-
228
-
229
-
230
-
231
-
232
-
233
-
234
-
235
-
236
-
237
-
238
-
239
-
240
-
241
-
242
-
243
-
244
-
245
-
246
-
247
-
248
-
249
-
250
-
251
-
252
-
253
-
254
 |
 |
institutions, including Regions. Lending and deposit activities and fee income generation are influenced by levels
of business spending and investment, consumer income, consumer spending and savings, capital market
activities, and competition among financial institutions, as well as customer preferences, interest rate conditions
and prevailing market rates on competing products in Regions’ market areas.
Regions’ business strategy has been and continues to be focused on providing a competitive mix of products
and services, delivering quality customer service and maintaining a branch distribution network with offices in
convenient locations.
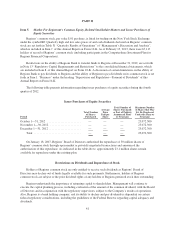
Dispositions
On January 11, 2012, Regions entered into a stock purchase agreement to sell Morgan Keegan and related
affiliates to Raymond James. The sale closed on April 2, 2012. Regions Investment Management, Inc. (formerly
known as Morgan Asset Management, Inc.) and Regions Trust were not included in the sale; they are included in
the Wealth Management segment.
Results of operations for the entities sold are presented separately as discontinued operations for all periods
presented on the consolidated statements of operations. Other expenses related to the transaction are also
included in discontinued operations. Refer to Note 3 “Discontinued Operations” and Note 23 “Commitments,
Contingencies, and Guarantees” for further details.
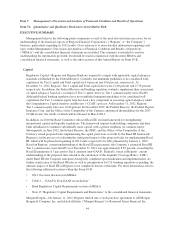
Business Segments
Regions provides traditional commercial, retail and mortgage banking services, as well as other financial
services in the fields of asset management, trust, insurance and other specialty financing. Regions carries out its
strategies and derives its profitability from the three reportable business segments: Business Services, Consumer
Services, and Wealth Management, with the remainder split between Discontinued Operations and Other. During
the third quarter of 2012, Regions reorganized its internal management structure and, accordingly, its segment
reporting structure. Historically, Regions’ primary business segment was Banking/Treasury, representing the
Company’s banking network (including the Consumer & Commercial Banking function along with the Treasury
function). Other segments included Investment Banking/Brokerage/Trust and Insurance. During the second
quarter of 2012, Regions consummated the sale of Morgan Keegan (the primary component of Investment
Banking/Brokerage/Trust). Shortly thereafter, Regions announced organizational changes to better integrate and
execute the Company’s strategic priorities across all lines of business and geographies. As a result, Regions
revised its reportable segments.
Business Services
The Business Services segment represents the Company’s commercial banking functions including
commercial and industrial, commercial real estate and investor real estate lending. This segment also includes
equipment lease financing. Business Services customers include corporate, middle market, small business and
commercial real estate developers and investors. Corresponding deposit products related to these types of
customers are included in this segment. In 2012, the Business Services reportable segment contributed
$631 million of net income.
Consumer Services
The Consumer Services segment represents the Company’s branch network, including consumer banking
products and services related to residential first mortgages, home equity lines and loans, indirect loans, consumer
credit cards and other consumer loans, as well as the corresponding deposit relationships. These services are also
provided through alternative channels such as the internet and telephone banking. In 2012, the Consumer
Services reportable segment contributed $420 million of net income.
48