Regions Bank 2012 Annual Report Download - page 108
Download and view the complete annual report
Please find page 108 of the 2012 Regions Bank annual report below. You can navigate through the pages in the report by either clicking on the pages listed below, or by using the keyword search tool below to find specific information within the annual report.-
 1
1 -
2
-
3
-
4
-
5
-
6
-
7
-
8
-
9
-
10
-
11
-
12
-
13
-
14
-
15
-
16
-
17
-
18
-
19
-
20
-
21
-
22
-
23
-
24
-
25
-
26
-
27
-
28
-
29
-
30
-
31
-
32
-
33
-
34
-
35
-
36
-
37
-
38
-
39
-
40
-
41
-
42
-
43
-
44
-
45
-
46
-
47
-
48
-
49
-
50
-
51
-
52
-
53
-
54
-
55
-
56
-
57
-
58
-
59
-
60
-
61
-
62
-
63
-
64
-
65
-
66
-
67
-
68
-
69
-
70
-
71
-
72
-
73
-
74
-
75
-
76
-
77
-
78
-
79
-
80
-
81
-
82
-
83
-
84
-
85
-
86
-
87
-
88
-
89
-
90
-
91
-
92
-
93
-
94
-
95
-
96
-
97
-
 98
98 -
 99
99 -
 100
100 -
 101
101 -
 102
102 -
 103
103 -
 104
104 -
 105
105 -
 106
106 -
 107
107 -
 108
108 -
 109
109 -
 110
110 -
 111
111 -
 112
112 -
 113
113 -
 114
114 -
 115
115 -
 116
116 -
 117
117 -
 118
118 -
119
-
120
-
121
-
122
-
123
-
124
-
125
-
126
-
127
-
128
-
129
-
130
-
131
-
132
-
133
-
134
-
135
-
136
-
137
-
138
-
139
-
140
-
141
-
142
-
143
-
144
-
145
-
146
-
147
-
148
-
149
-
150
-
151
-
152
-
153
-
154
-
155
-
156
-
157
-
158
-
159
-
160
-
161
-
162
-
163
-
164
-
165
-
166
-
167
-
168
-
169
-
170
-
171
-
172
-
173
-
174
-
175
-
176
-
177
-
178
-
179
-
180
-
181
-
182
-
183
-
184
-
185
-
186
-
187
-
188
-
189
-
190
-
191
-
192
-
193
-
194
-
195
-
196
-
197
-
198
-
199
-
200
-
201
-
202
-
203
-
204
-
205
-
206
-
207
-
208
-
209
-
210
-
211
-
212
-
213
-
214
-
215
-
216
-
217
-
218
-
219
-
220
-
221
-
222
-
223
-
224
-
225
-
226
-
227
-
228
-
229
-
230
-
231
-
232
-
233
-
234
-
235
-
236
-
237
-
238
-
239
-
240
-
241
-
242
-
243
-
244
-
245
-
246
-
247
-
248
-
249
-
250
-
251
-
252
-
253
-
254
 |
 |

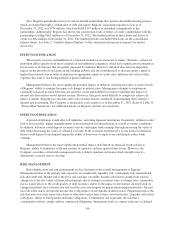
Valuation adjustments are primarily recorded in other non-interest expense; adjustments are also recorded as
a charge to the allowance for loan losses if incurred within 60 days after the date of transfer from loans.
Valuation adjustments are primarily post-foreclosure write-downs that are a result of continued declining
property values based on updated appraisals or other indications of value, such as offers to purchase. Foreclosed
property sold represents the net book value of the properties sold.
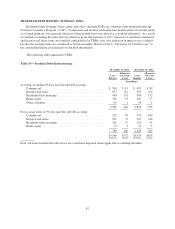
Other Assets
Other assets decreased $2.6 billion to $6.2 billion as of December 31, 2012. Securities sold but not yet
settled balances at the end of 2011, which did not repeat in 2012, and lower derivative assets primarily drove the
decrease. Reduced foreclosed properties, deferred income taxes and prepaid expense balances also contributed to
the year-over-year decrease.
Deposits
Regions competes with other banking and financial services companies for a share of the deposit market.
Regions’ ability to compete in the deposit market depends heavily on the pricing of its deposits and how
effectively the Company meets customers’ needs. Regions employs various means to meet those needs and
enhance competitiveness, such as providing a high level of customer service, competitive pricing and providing
convenient branch locations for its customers. Regions also serves customers through providing centralized,
high-quality banking services and alternative product delivery channels such as internet banking.
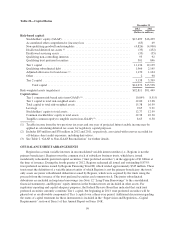
Deposits are Regions’ primary source of funds, providing funding for 88 percent of average interest-earning
assets from continuing operations in 2012 and 85 percent of average interest-earning assets from continuing
operations in 2011. Table 24 “Deposits” details year-over-year deposits on a period-ending basis. Total deposits
at December 31, 2012, decreased approximately $153 million compared to year-end 2011 levels. The overall
decrease was driven by a significant decrease in time deposits. This decrease was largely offset by increases in
almost all categories of low-cost deposits. Regions continued to focus on shifting the overall deposit mix toward
low-cost deposits, with an emphasis on non-interest-bearing demand and interest-bearing transaction accounts, in
an effort to reduce funding costs.
Customer deposits, which exclude deposits used for wholesale funding purposes, decreased by 0.2 percent
to $95.5 billion on an ending basis during 2012. Due to liquidity in the market, Regions has been able to steadily
grow its low-cost customer deposits and reduce its total deposit costs from 0.78 percent in 2010 to 0.49 percent
in 2011 and to 0.30 percent in 2012.
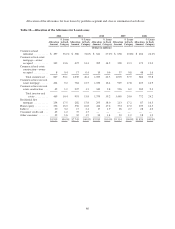
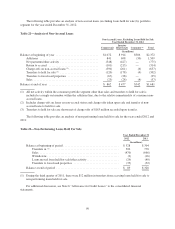
Table 24—Deposits
2012 2011 2010
(In millions)
Non-interest-bearing demand* .................................................. $29,963 $28,209 $25,683
Savings accounts ............................................................. 5,760 5,159 4,668
Interest-bearing transaction accounts ............................................. 21,096 19,388 13,423
Money market accounts—domestic* ............................................. 24,901 23,028 27,396
Money market accounts—foreign* ............................................... 311 460 643
Low-cost deposits ........................................................ 82,031 76,244 71,813
Time deposits ............................................................... 13,443 19,378 22,784
Customer deposits ........................................................ 95,474 95,622 94,597
Corporate treasury time deposits ................................................. — 5 17
$95,474 $95,627 $94,614
* Prior period amounts have been reclassified to conform to current period classification
92