Regions Bank 2012 Annual Report Download - page 92
Download and view the complete annual report
Please find page 92 of the 2012 Regions Bank annual report below. You can navigate through the pages in the report by either clicking on the pages listed below, or by using the keyword search tool below to find specific information within the annual report.-
 1
1 -
2
-
3
-
4
-
5
-
6
-
7
-
8
-
9
-
10
-
11
-
12
-
13
-
14
-
15
-
16
-
17
-
18
-
19
-
20
-
21
-
22
-
23
-
24
-
25
-
26
-
27
-
28
-
29
-
30
-
31
-
32
-
33
-
34
-
35
-
36
-
37
-
38
-
39
-
40
-
41
-
42
-
43
-
44
-
45
-
46
-
47
-
48
-
49
-
50
-
51
-
52
-
53
-
54
-
55
-
56
-
57
-
58
-
59
-
60
-
61
-
62
-
63
-
64
-
65
-
66
-
67
-
68
-
69
-
70
-
71
-
72
-
73
-
74
-
75
-
76
-
77
-
78
-
79
-
80
-
81
-
 82
82 -
 83
83 -
 84
84 -
 85
85 -
 86
86 -
 87
87 -
 88
88 -
 89
89 -
 90
90 -
 91
91 -
 92
92 -
 93
93 -
 94
94 -
 95
95 -
 96
96 -
 97
97 -
 98
98 -
 99
99 -
 100
100 -
 101
101 -
 102
102 -
103
-
104
-
105
-
106
-
107
-
108
-
109
-
110
-
111
-
112
-
113
-
114
-
115
-
116
-
117
-
118
-
119
-
120
-
121
-
122
-
123
-
124
-
125
-
126
-
127
-
128
-
129
-
130
-
131
-
132
-
133
-
134
-
135
-
136
-
137
-
138
-
139
-
140
-
141
-
142
-
143
-
144
-
145
-
146
-
147
-
148
-
149
-
150
-
151
-
152
-
153
-
154
-
155
-
156
-
157
-
158
-
159
-
160
-
161
-
162
-
163
-
164
-
165
-
166
-
167
-
168
-
169
-
170
-
171
-
172
-
173
-
174
-
175
-
176
-
177
-
178
-
179
-
180
-
181
-
182
-
183
-
184
-
185
-
186
-
187
-
188
-
189
-
190
-
191
-
192
-
193
-
194
-
195
-
196
-
197
-
198
-
199
-
200
-
201
-
202
-
203
-
204
-
205
-
206
-
207
-
208
-
209
-
210
-
211
-
212
-
213
-
214
-
215
-
216
-
217
-
218
-
219
-
220
-
221
-
222
-
223
-
224
-
225
-
226
-
227
-
228
-
229
-
230
-
231
-
232
-
233
-
234
-
235
-
236
-
237
-
238
-
239
-
240
-
241
-
242
-
243
-
244
-
245
-
246
-
247
-
248
-
249
-
250
-
251
-
252
-
253
-
254
 |
 |

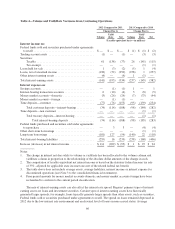
before its market value recovers. During 2012 and 2011, Regions recognized minimal levels of securities
impairments in earnings. See Note 4 “Securities” to the consolidated financial statements for further details.
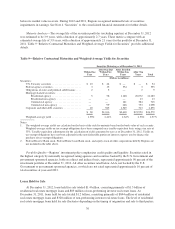
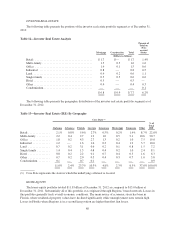
Maturity Analysis—The average life of the securities portfolio (excluding equities) at December 31, 2012
was estimated to be 3.9 years, with a duration of approximately 2.7 years. These metrics compare with an
estimated average life of 3.9 years, with a duration of approximately 2.1 years for the portfolio at December 31,
2011. Table 9 “Relative Contractual Maturities and Weighted-Average Yields for Securities” provides additional
details.
Table 9—Relative Contractual Maturities and Weighted-Average Yields for Securities
Securities Maturing as of December 31, 2012
Within One
Year
After One But
Within Five
Years
After Five But
Within Ten
Years
After Ten
Years Total
(Dollars in millions)
Securities:
U.S. Treasury securities ...................... $ 10 $ 44 $ — $ — $ 54
Federal agency securities ..................... 3 15 534 3 555
Obligations of states and political subdivisions .... 2 5 — 2 9
Mortgage-backed securities: ..................
Residential agency ...................... 5 58 1,148 20,072 21,283
Residential non-agency .................. — — — 13 13
Commercial agency ..................... — — 141 584 725
Commercial non-agency ................. — 99 246 753 1,098
Corporate and other debt securities ............. 18 945 1,349 523 2,835
$ 38 $1,166 $3,418 $21,950 $26,572
Weighted-average yield ...................... 1.90% 2.42% 2.64% 2.56% 2.57%
Notes:
1. The weighted-average yields are calculated on the basis of the yield to maturity based on the book value of each security.
Weighted-average yields on tax-exempt obligations have been computed on a taxable-equivalent basis using a tax rate of
35%. Taxable-equivalent adjustments for the calculation of yields amounted to zero as of December 31, 2012. Yields on
tax-exempt obligations have not been adjusted for the non-deductible portion of interest expense used to finance the
purchase of tax-exempt obligations.
2. Federal Reserve Bank stock, Federal Home Loan Bank stock, and equity stock of other corporations held by Regions are
not included in the table above.
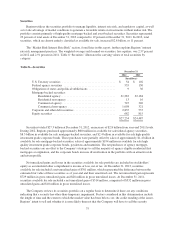
Portfolio Quality—Regions’ investment policy emphasizes credit quality and liquidity. Securities rated in
the highest category by nationally recognized rating agencies and securities backed by the U.S. Government and
government sponsored agencies, both on a direct and indirect basis, represented approximately 90 percent of the
investment portfolio at December 31, 2012. All other securities rated below AAA, not backed by the U.S.
Government or government sponsored agencies, or which are not rated represented approximately 10 percent of
total securities at year-end 2012.
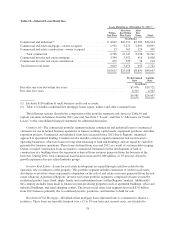
Loans Held for Sale
At December 31, 2012, loans held for sale totaled $1.4 billion, consisting primarily of $1.3 billion of
residential real estate mortgage loans and $89 million of non-performing investor real estate loans. At
December 31, 2011, loans held for sale totaled $1.2 billion, consisting primarily of $844 million of residential
real estate mortgage loans and $328 million of non-performing investor real estate loans. The level of residential
real estate mortgage loans held for sale fluctuates depending on the timing of origination and sale to third parties.
76