Regions Bank 2012 Annual Report Download - page 135
Download and view the complete annual report
Please find page 135 of the 2012 Regions Bank annual report below. You can navigate through the pages in the report by either clicking on the pages listed below, or by using the keyword search tool below to find specific information within the annual report.-
 1
1 -
2
-
3
-
4
-
5
-
6
-
7
-
8
-
9
-
10
-
11
-
12
-
13
-
14
-
15
-
16
-
17
-
18
-
19
-
20
-
21
-
22
-
23
-
24
-
25
-
26
-
27
-
28
-
29
-
30
-
31
-
32
-
33
-
34
-
35
-
36
-
37
-
38
-
39
-
40
-
41
-
42
-
43
-
44
-
45
-
46
-
47
-
48
-
49
-
50
-
51
-
52
-
53
-
54
-
55
-
56
-
57
-
58
-
59
-
60
-
61
-
62
-
63
-
64
-
65
-
66
-
67
-
68
-
69
-
70
-
71
-
72
-
73
-
74
-
75
-
76
-
77
-
78
-
79
-
80
-
81
-
82
-
83
-
84
-
85
-
86
-
87
-
88
-
89
-
90
-
91
-
92
-
93
-
94
-
95
-
96
-
97
-
98
-
99
-
100
-
101
-
102
-
103
-
104
-
105
-
106
-
107
-
108
-
109
-
110
-
111
-
112
-
113
-
114
-
115
-
116
-
117
-
118
-
119
-
120
-
121
-
122
-
123
-
124
-
 125
125 -
 126
126 -
 127
127 -
 128
128 -
 129
129 -
 130
130 -
 131
131 -
 132
132 -
 133
133 -
 134
134 -
 135
135 -
 136
136 -
 137
137 -
 138
138 -
 139
139 -
 140
140 -
 141
141 -
 142
142 -
 143
143 -
 144
144 -
 145
145 -
146
-
147
-
148
-
149
-
150
-
151
-
152
-
153
-
154
-
155
-
156
-
157
-
158
-
159
-
160
-
161
-
162
-
163
-
164
-
165
-
166
-
167
-
168
-
169
-
170
-
171
-
172
-
173
-
174
-
175
-
176
-
177
-
178
-
179
-
180
-
181
-
182
-
183
-
184
-
185
-
186
-
187
-
188
-
189
-
190
-
191
-
192
-
193
-
194
-
195
-
196
-
197
-
198
-
199
-
200
-
201
-
202
-
203
-
204
-
205
-
206
-
207
-
208
-
209
-
210
-
211
-
212
-
213
-
214
-
215
-
216
-
217
-
218
-
219
-
220
-
221
-
222
-
223
-
224
-
225
-
226
-
227
-
228
-
229
-
230
-
231
-
232
-
233
-
234
-
235
-
236
-
237
-
238
-
239
-
240
-
241
-
242
-
243
-
244
-
245
-
246
-
247
-
248
-
249
-
250
-
251
-
252
-
253
-
254
 |
 |

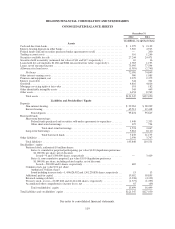
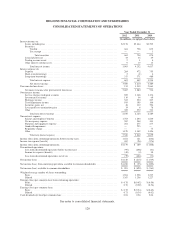
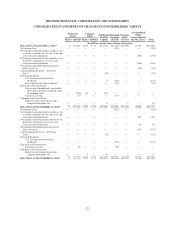
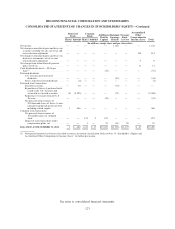
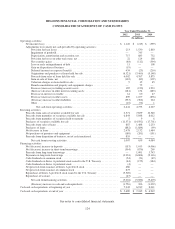
REGIONS FINANCIAL CORPORATION AND SUBSIDIARIES
CONSOLIDATED BALANCE SHEETS
December 31
2012 2011
(In millions, except share data)
Assets
Cash and due from banks ........................................................ $ 1,979 $ 2,132
Interest-bearing deposits in other banks ............................................. 3,510 4,913
Federal funds sold and securities purchased under agreements to resell .................... — 200
Trading account assets .......................................................... 116 1,266
Securities available for sale ...................................................... 27,244 24,471
Securities held to maturity (estimated fair value of $11 and $17, respectively) .............. 10 16
Loans held for sale (includes $1,282 and $844 measured at fair value, respectively) .......... 1,383 1,193
Loans, net of unearned income .................................................... 73,995 77,594
Allowance for loan losses ........................................................ (1,919) (2,745)
Net loans ................................................................. 72,076 74,849
Other interest-earning assets ...................................................... 900 1,085
Premises and equipment, net ..................................................... 2,279 2,375
Interest receivable .............................................................. 344 361
Goodwill ..................................................................... 4,816 4,816
Mortgage servicing rights at fair value .............................................. 191 182
Other identifiable intangible assets ................................................ 345 449
Other assets ................................................................... 6,154 8,742
Total assets ............................................................... $121,347 $127,050
Liabilities and Stockholders’ Equity
Deposits:
Non-interest-bearing ........................................................ $ 29,963 $ 28,209
Interest-bearing ............................................................ 65,511 67,418
Total deposits ......................................................... 95,474 95,627
Borrowed funds:
Short-term borrowings:
Federal funds purchased and securities sold under agreements to repurchase ........ 1,449 2,333
Other short-term borrowings ............................................. 125 734
Total short-term borrowings ...................................... 1,574 3,067
Long-term borrowings ...................................................... 5,861 8,110
Total borrowed funds ........................................... 7,435 11,177
Other liabilities ................................................................ 2,939 3,747
Total liabilities ............................................................ 105,848 110,551
Stockholders’ equity:
Preferred stock, authorized 10 million shares:
Series A, cumulative perpetual participating, par value $1.00 (liquidation preference
$1,000.00) per share, net of discount;
Issued—0 and 3,500,000 shares, respectively ............................ — 3,419
Series A, non-cumulative perpetual, par value $1.00 (liquidation preference
$1,000.00) per share, including related surplus, net of discount;
Issued—500,000 and 0 shares, respectively .............................. 482 —
Common stock, par value $.01 per share:
Authorized 3 billion shares
Issued including treasury stock—1,454,626,952 and 1,301,230,838 shares, respectively . . .
15 13
Additional paid-in capital .................................................... 19,652 18,855
Retained earnings (deficit) ................................................... (3,338) (4,322)
Treasury stock, at cost—41,287,460 and 42,414,444 shares, respectively .............. (1,377) (1,397)
Accumulated other comprehensive income (loss), net .............................. 65 (69)
Total stockholders’ equity ............................................... 15,499 16,499
Total liabilities and stockholders’ equity ............................................ $121,347 $127,050
See notes to consolidated financial statements.
119