Regions Bank 2012 Annual Report Download - page 157
Download and view the complete annual report
Please find page 157 of the 2012 Regions Bank annual report below. You can navigate through the pages in the report by either clicking on the pages listed below, or by using the keyword search tool below to find specific information within the annual report.-
 1
1 -
2
-
3
-
4
-
5
-
6
-
7
-
8
-
9
-
10
-
11
-
12
-
13
-
14
-
15
-
16
-
17
-
18
-
19
-
20
-
21
-
22
-
23
-
24
-
25
-
26
-
27
-
28
-
29
-
30
-
31
-
32
-
33
-
34
-
35
-
36
-
37
-
38
-
39
-
40
-
41
-
42
-
43
-
44
-
45
-
46
-
47
-
48
-
49
-
50
-
51
-
52
-
53
-
54
-
55
-
56
-
57
-
58
-
59
-
60
-
61
-
62
-
63
-
64
-
65
-
66
-
67
-
68
-
69
-
70
-
71
-
72
-
73
-
74
-
75
-
76
-
77
-
78
-
79
-
80
-
81
-
82
-
83
-
84
-
85
-
86
-
87
-
88
-
89
-
90
-
91
-
92
-
93
-
94
-
95
-
96
-
97
-
98
-
99
-
100
-
101
-
102
-
103
-
104
-
105
-
106
-
107
-
108
-
109
-
110
-
111
-
112
-
113
-
114
-
115
-
116
-
117
-
118
-
119
-
120
-
121
-
122
-
123
-
124
-
125
-
126
-
127
-
128
-
129
-
130
-
131
-
132
-
133
-
134
-
135
-
136
-
137
-
138
-
139
-
140
-
141
-
142
-
143
-
144
-
145
-
146
-
 147
147 -
 148
148 -
 149
149 -
 150
150 -
 151
151 -
 152
152 -
 153
153 -
 154
154 -
 155
155 -
 156
156 -
 157
157 -
 158
158 -
 159
159 -
 160
160 -
 161
161 -
 162
162 -
 163
163 -
 164
164 -
 165
165 -
 166
166 -
 167
167 -
168
-
169
-
170
-
171
-
172
-
173
-
174
-
175
-
176
-
177
-
178
-
179
-
180
-
181
-
182
-
183
-
184
-
185
-
186
-
187
-
188
-
189
-
190
-
191
-
192
-
193
-
194
-
195
-
196
-
197
-
198
-
199
-
200
-
201
-
202
-
203
-
204
-
205
-
206
-
207
-
208
-
209
-
210
-
211
-
212
-
213
-
214
-
215
-
216
-
217
-
218
-
219
-
220
-
221
-
222
-
223
-
224
-
225
-
226
-
227
-
228
-
229
-
230
-
231
-
232
-
233
-
234
-
235
-
236
-
237
-
238
-
239
-
240
-
241
-
242
-
243
-
244
-
245
-
246
-
247
-
248
-
249
-
250
-
251
-
252
-
253
-
254
 |
 |
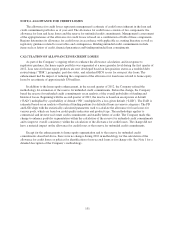
made, must be based on sufficient information available to support an alternate opinion of market value. An
estimated standard discount factor, which is updated at least annually, is applied to the appraisal amount for
certain commercial and investor real estate properties when the recorded investment in the loan is transferred into
foreclosed property. Internally adjusted valuations are considered Level 3 measurements as management uses
assumptions that may not be observable in the market.
Loans held for sale for which the fair value option has not been elected are recorded at the lower of cost or
fair value and therefore are reported at fair value on a non-recurring basis. The fair values for loans held for sale
that are based on formally committed loan sale prices or valuations performed using observable inputs are
classified as a Level 2 measurement. If no formally committed sales price is available, a professional valuation is
obtained, consistent with the process described above for foreclosed property and other real estate.
FAIR VALUE OF FINANCIAL INSTRUMENTS
The following methods and assumptions were used by the Company in estimating fair values of financial
instruments that are not disclosed above:
Cash and cash equivalents: The carrying amounts reported in the consolidated balance sheets and cash
flows approximate the estimated fair values. Because these amounts generally relate to either currency or highly
liquid assets, these are considered Level 1 valuations.
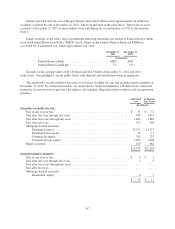
Securities held to maturity: The fair values of securities held to maturity are estimated in the same manner
as the corresponding securities available for sale, which are measured at fair value on a recurring basis.
Loans, (excluding leases), net of unearned income and allowance for loan losses: A discounted cash
flow method under the income approach is utilized to estimate the fair value of the loan portfolio. The discounted
cash flow method relies upon assumptions about the amount and timing of principal and interest payments,
principal prepayments, and estimates of principal defaults, loss given default, and current market rates (excluding
credit). The loan portfolio is aggregated into categories based on loan type and credit quality. For each loan
category, weighted average statistics, such as coupon rate, age, and remaining term are calculated. These are
Level 3 valuations.
Other interest-earning assets: The carrying amounts reported in the consolidated balance sheets
approximate the estimated fair values. While these instruments are not actively traded in the market, the majority
of the inputs required to value them are actively quoted and can be validated through external sources.
Accordingly, these are Level 2 valuations.
Deposits: The fair value of non-interest-bearing demand accounts, interest-bearing transaction accounts,
savings accounts, money market accounts and certain other time deposit accounts is the amount payable on
demand at the reporting date (i.e., the carrying amount). Fair values for certificates of deposit are estimated by
using discounted cash flow analyses, based on market spreads to benchmark rates. These are Level 2 valuations.
Short-term and long-term borrowings: The carrying amounts of short-term borrowings reported in the
consolidated balance sheets approximate the estimated fair values, and are considered Level 2 measurements as
similar instruments are traded in active markets. The fair values of certain long-term borrowings are estimated
using quoted market prices of identical instruments and are considered Level 1 measurements. If identical
instruments are not available, fair values are estimated using quoted market prices for similar instruments and are
considered Level 2 valuations. Otherwise, valuations are based on a combination of non-binding broker quotes
and quoted prices for identical instruments in non-active markets and are considered Level 3 valuations.
Loan commitments and letters of credit: The estimated fair values for these off-balance sheet instruments
are based on probabilities of funding to project future loan fundings, which are discounted using the loan
methodology described above. The premiums/discounts are adjusted for the time value of money over the
141