Regions Bank 2012 Annual Report Download - page 72
Download and view the complete annual report
Please find page 72 of the 2012 Regions Bank annual report below. You can navigate through the pages in the report by either clicking on the pages listed below, or by using the keyword search tool below to find specific information within the annual report.-
 1
1 -
2
-
3
-
4
-
5
-
6
-
7
-
8
-
9
-
10
-
11
-
12
-
13
-
14
-
15
-
16
-
17
-
18
-
19
-
20
-
21
-
22
-
23
-
24
-
25
-
26
-
27
-
28
-
29
-
30
-
31
-
32
-
33
-
34
-
35
-
36
-
37
-
38
-
39
-
40
-
41
-
42
-
43
-
44
-
45
-
46
-
47
-
48
-
49
-
50
-
51
-
52
-
53
-
54
-
55
-
56
-
57
-
58
-
59
-
60
-
61
-
 62
62 -
 63
63 -
 64
64 -
 65
65 -
 66
66 -
 67
67 -
 68
68 -
 69
69 -
 70
70 -
 71
71 -
 72
72 -
 73
73 -
 74
74 -
 75
75 -
 76
76 -
 77
77 -
 78
78 -
 79
79 -
 80
80 -
 81
81 -
 82
82 -
83
-
84
-
85
-
86
-
87
-
88
-
89
-
90
-
91
-
92
-
93
-
94
-
95
-
96
-
97
-
98
-
99
-
100
-
101
-
102
-
103
-
104
-
105
-
106
-
107
-
108
-
109
-
110
-
111
-
112
-
113
-
114
-
115
-
116
-
117
-
118
-
119
-
120
-
121
-
122
-
123
-
124
-
125
-
126
-
127
-
128
-
129
-
130
-
131
-
132
-
133
-
134
-
135
-
136
-
137
-
138
-
139
-
140
-
141
-
142
-
143
-
144
-
145
-
146
-
147
-
148
-
149
-
150
-
151
-
152
-
153
-
154
-
155
-
156
-
157
-
158
-
159
-
160
-
161
-
162
-
163
-
164
-
165
-
166
-
167
-
168
-
169
-
170
-
171
-
172
-
173
-
174
-
175
-
176
-
177
-
178
-
179
-
180
-
181
-
182
-
183
-
184
-
185
-
186
-
187
-
188
-
189
-
190
-
191
-
192
-
193
-
194
-
195
-
196
-
197
-
198
-
199
-
200
-
201
-
202
-
203
-
204
-
205
-
206
-
207
-
208
-
209
-
210
-
211
-
212
-
213
-
214
-
215
-
216
-
217
-
218
-
219
-
220
-
221
-
222
-
223
-
224
-
225
-
226
-
227
-
228
-
229
-
230
-
231
-
232
-
233
-
234
-
235
-
236
-
237
-
238
-
239
-
240
-
241
-
242
-
243
-
244
-
245
-
246
-
247
-
248
-
249
-
250
-
251
-
252
-
253
-
254
 |
 |

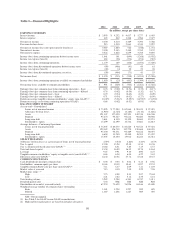
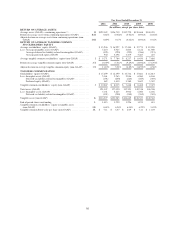
For Year Ended December 31
2012 2011 2010 2009 2008
(In millions, except per share data)
RETURN ON AVERAGE ASSETS
Average assets (GAAP)—continuing operations (2) ................. H $122,182 $126,719 $132,720 $139,468 $140,455
Return on average assets from continuing operations (GAAP) ........ B/H 0.86% (0.02)% (0.52)% (0.93)% (4.04)%
Adjusted return on average assets from continuing operations (non-
GAAP) ................................................. D/H 0.89% 0.17% (0.46)% (0.93)% 0.32%
RETURN ON AVERAGE TANGIBLE COMMON
STOCKHOLDERS’ EQUITY
Average stockholders’ equity (GAAP) ........................... $ 15,246 $ 16,927 $ 17,444 $ 17,773 $ 19,939
Less: Average intangible assets (GAAP) ......................... 5,210 5,965 6,003 6,122 11,949
Average deferred tax liability related to intangibles (GAAP) ..... (195) (220) (255) (286) (321)
Average preferred equity (GAAP) ......................... 960 3,398 3,479 3,487 425
Average tangible common stockholders’ equity (non-GAAP) ......... I $ 9,271 $ 7,784 $ 8,217 $ 8,450 $ 7,886
Return on average tangible common equity (non-GAAP) ............ A/I 10.69% (5.51)% (9.29)% (14.92)% (71.29)%
Adjusted return on average tangible common equity (non-GAAP) ..... C/I 11.10% 3.31% (6.85)% (14.92)% 6.38%
TANGIBLE COMMON RATIOS
Stockholders’ equity (GAAP) .................................. $ 15,499 $ 16,499 $ 16,734 $ 17,881 $ 16,813
Less: Intangible assets (GAAP) ................................ 5,161 5,265 5,946 6,060 6,186
Deferred tax liability related to intangibles (GAAP) ............ (191) (200) (240) (269) (303)
Preferred equity (GAAP) ................................. 482 3,419 3,380 3,602 3,307
Tangible common stockholders’ equity (non-GAAP) ............... J $ 10,047 $ 8,015 $ 7,648 $ 8,488 $ 7,623
Total assets (GAAP) ......................................... 121,347 127,050 132,351 142,318 146,248
Less: Intangible assets (GAAP) ................................ 5,161 5,265 5,946 6,060 6,186
Deferred tax liability related to intangibles (GAAP) ............ (191) (200) (240) (269) (303)
Tangible assets (non-GAAP) .................................. K $116,377 $121,985 $126,645 $136,527 $140,365
End of period shares outstanding ............................... L 1,413 1,259 1,256 1,193 691
Tangible common stockholders’ equity to tangible assets
(non-GAAP) ............................................. J/K 8.63% 6.58% 6.04% 6.22% 5.43%
Tangible common book value per share (non-GAAP) ............... J/L $ 7.11 $ 6.37 $ 6.09 $ 7.11 $ 11.03
56