Regions Bank 2012 Annual Report Download - page 78
Download and view the complete annual report
Please find page 78 of the 2012 Regions Bank annual report below. You can navigate through the pages in the report by either clicking on the pages listed below, or by using the keyword search tool below to find specific information within the annual report.-
 1
1 -
2
-
3
-
4
-
5
-
6
-
7
-
8
-
9
-
10
-
11
-
12
-
13
-
14
-
15
-
16
-
17
-
18
-
19
-
20
-
21
-
22
-
23
-
24
-
25
-
26
-
27
-
28
-
29
-
30
-
31
-
32
-
33
-
34
-
35
-
36
-
37
-
38
-
39
-
40
-
41
-
42
-
43
-
44
-
45
-
46
-
47
-
48
-
49
-
50
-
51
-
52
-
53
-
54
-
55
-
56
-
57
-
58
-
59
-
60
-
61
-
62
-
63
-
64
-
65
-
66
-
67
-
 68
68 -
 69
69 -
 70
70 -
 71
71 -
 72
72 -
 73
73 -
 74
74 -
 75
75 -
 76
76 -
 77
77 -
 78
78 -
 79
79 -
 80
80 -
 81
81 -
 82
82 -
 83
83 -
 84
84 -
 85
85 -
 86
86 -
 87
87 -
 88
88 -
89
-
90
-
91
-
92
-
93
-
94
-
95
-
96
-
97
-
98
-
99
-
100
-
101
-
102
-
103
-
104
-
105
-
106
-
107
-
108
-
109
-
110
-
111
-
112
-
113
-
114
-
115
-
116
-
117
-
118
-
119
-
120
-
121
-
122
-
123
-
124
-
125
-
126
-
127
-
128
-
129
-
130
-
131
-
132
-
133
-
134
-
135
-
136
-
137
-
138
-
139
-
140
-
141
-
142
-
143
-
144
-
145
-
146
-
147
-
148
-
149
-
150
-
151
-
152
-
153
-
154
-
155
-
156
-
157
-
158
-
159
-
160
-
161
-
162
-
163
-
164
-
165
-
166
-
167
-
168
-
169
-
170
-
171
-
172
-
173
-
174
-
175
-
176
-
177
-
178
-
179
-
180
-
181
-
182
-
183
-
184
-
185
-
186
-
187
-
188
-
189
-
190
-
191
-
192
-
193
-
194
-
195
-
196
-
197
-
198
-
199
-
200
-
201
-
202
-
203
-
204
-
205
-
206
-
207
-
208
-
209
-
210
-
211
-
212
-
213
-
214
-
215
-
216
-
217
-
218
-
219
-
220
-
221
-
222
-
223
-
224
-
225
-
226
-
227
-
228
-
229
-
230
-
231
-
232
-
233
-
234
-
235
-
236
-
237
-
238
-
239
-
240
-
241
-
242
-
243
-
244
-
245
-
246
-
247
-
248
-
249
-
250
-
251
-
252
-
253
-
254
 |
 |

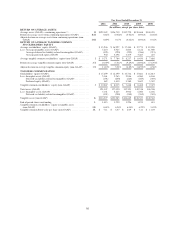
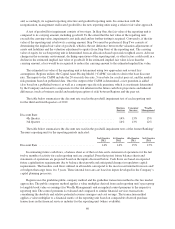
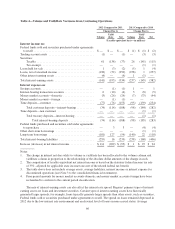
Impact to the Carrying Value of Goodwill
Business Services Reporting Unit
Change in Discount Rate
Estimated Amount
of Impairment
(In millions)
+ 7.1% (from 14% to 21.1%) ...................... $ (a)
+ 8.0% ........................................ (147)
+ 9.0% ........................................ (219)
Improvement in Loan Fair Values (b)
+ 4.4 Percentage Points ........................... $ (a)
+ 5.4 Percentage Points ........................... (435)
+ 6.4 Percentage Points ........................... (868)
(a) Represents the point at which the implied fair value of goodwill would approximate its carrying value.
(b) Business Services loan discount to fair value is 7.9%.
The sensitivity calculations above are hypothetical and should not be considered to be predictive of future
performance. Changes in implied fair value based on adverse changes in assumptions generally cannot be
extrapolated because the relationship of the change in assumption to the change in fair value may not be linear.
Also, the effect of an adverse variation in a particular assumption on the implied fair value of goodwill is
calculated without changing any other assumption, while in reality changes in one factor may result in changes in
another which may either magnify or counteract the effect of the change.
Other identifiable intangible assets, primarily core deposit intangibles and credit card intangibles, are
reviewed at least annually (usually in the fourth quarter) for events or circumstances which could impact the
recoverability of the intangible asset. These events could include loss of core deposits, significant losses of credit
card accounts and/or balances, increased competition or adverse changes in the economy. To the extent an other
identifiable intangible asset is deemed unrecoverable, an impairment loss would be recorded to reduce the
carrying amount. These events or circumstances, if they occur, could be material to Regions’ operating results for
any particular reporting period but the potential impact cannot be reasonably estimated.
Mortgage Servicing Rights
Regions estimates the fair value of its mortgage servicing rights in order to record them at fair value on the
balance sheet. Although sales of mortgage servicing rights do occur, mortgage servicing rights do not trade in an
active market with readily observable market prices and the exact terms and conditions of sales may not be
readily available, and are therefore Level 3 valuations in the fair value hierarchy previously discussed in the “Fair
Value Measurements” section. Specific characteristics of the underlying loans greatly impact the estimated value
of the related mortgage servicing rights. As a result, Regions stratifies its mortgage servicing portfolio on the
basis of certain risk characteristics, including loan type and contractual note rate, and values its mortgage
servicing rights using discounted cash flow modeling techniques. These techniques require management to make
estimates regarding future net servicing cash flows, taking into consideration historical and forecasted mortgage
loan prepayment rates, discount rates, escrow balances and servicing costs. Changes in interest rates, prepayment
speeds or other factors impact the fair value of mortgage servicing rights which impacts earnings. Based on a
hypothetical sensitivity analysis, Regions estimates that a reduction in primary mortgage market rates of 25 basis
points and 50 basis points would reduce the December 31, 2012 fair value of mortgage servicing rights by
approximately 7 percent ($13 million) and 14 percent ($26 million), respectively. Conversely, 25 basis point and
50 basis point increases in these rates would increase the December 31, 2012 fair value of mortgage servicing
rights by approximately 7 percent ($14 million) and 15 percent ($28 million), respectively. Regions also
estimates that an increase in servicing costs of approximately $10 per loan, or 18 percent, would result in a
decline in the value of the mortgage servicing rights by approximately $7 million or 3 basis points.
62