Regions Bank 2012 Annual Report Download - page 75
Download and view the complete annual report
Please find page 75 of the 2012 Regions Bank annual report below. You can navigate through the pages in the report by either clicking on the pages listed below, or by using the keyword search tool below to find specific information within the annual report.-
 1
1 -
2
-
3
-
4
-
5
-
6
-
7
-
8
-
9
-
10
-
11
-
12
-
13
-
14
-
15
-
16
-
17
-
18
-
19
-
20
-
21
-
22
-
23
-
24
-
25
-
26
-
27
-
28
-
29
-
30
-
31
-
32
-
33
-
34
-
35
-
36
-
37
-
38
-
39
-
40
-
41
-
42
-
43
-
44
-
45
-
46
-
47
-
48
-
49
-
50
-
51
-
52
-
53
-
54
-
55
-
56
-
57
-
58
-
59
-
60
-
61
-
62
-
63
-
64
-
 65
65 -
 66
66 -
 67
67 -
 68
68 -
 69
69 -
 70
70 -
 71
71 -
 72
72 -
 73
73 -
 74
74 -
 75
75 -
 76
76 -
 77
77 -
 78
78 -
 79
79 -
 80
80 -
 81
81 -
 82
82 -
 83
83 -
 84
84 -
 85
85 -
86
-
87
-
88
-
89
-
90
-
91
-
92
-
93
-
94
-
95
-
96
-
97
-
98
-
99
-
100
-
101
-
102
-
103
-
104
-
105
-
106
-
107
-
108
-
109
-
110
-
111
-
112
-
113
-
114
-
115
-
116
-
117
-
118
-
119
-
120
-
121
-
122
-
123
-
124
-
125
-
126
-
127
-
128
-
129
-
130
-
131
-
132
-
133
-
134
-
135
-
136
-
137
-
138
-
139
-
140
-
141
-
142
-
143
-
144
-
145
-
146
-
147
-
148
-
149
-
150
-
151
-
152
-
153
-
154
-
155
-
156
-
157
-
158
-
159
-
160
-
161
-
162
-
163
-
164
-
165
-
166
-
167
-
168
-
169
-
170
-
171
-
172
-
173
-
174
-
175
-
176
-
177
-
178
-
179
-
180
-
181
-
182
-
183
-
184
-
185
-
186
-
187
-
188
-
189
-
190
-
191
-
192
-
193
-
194
-
195
-
196
-
197
-
198
-
199
-
200
-
201
-
202
-
203
-
204
-
205
-
206
-
207
-
208
-
209
-
210
-
211
-
212
-
213
-
214
-
215
-
216
-
217
-
218
-
219
-
220
-
221
-
222
-
223
-
224
-
225
-
226
-
227
-
228
-
229
-
230
-
231
-
232
-
233
-
234
-
235
-
236
-
237
-
238
-
239
-
240
-
241
-
242
-
243
-
244
-
245
-
246
-
247
-
248
-
249
-
250
-
251
-
252
-
253
-
254
 |
 |
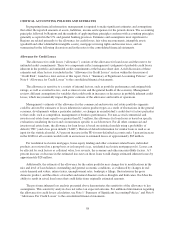
Fair Value Measurements
A portion of the Company’s assets and liabilities is carried at fair value, with changes in fair value recorded
either in earnings or accumulated other comprehensive income (loss). These include trading account assets and
liabilities, securities available for sale, mortgage loans held for sale, mortgage servicing rights and derivative
assets and liabilities. From time to time, the estimation of fair value also affects other loans held for sale, which
are recorded at the lower of cost or fair value. Fair value determination is also relevant for certain other assets
such as foreclosed property and other real estate, which are recorded at the lower of the recorded investment in
the loan/property or fair value, less estimated costs to sell the property. For example, the fair value of other real
estate is determined based on recent appraisals by third parties and other market information, less estimated
selling costs. Adjustments to the appraised value are made if management becomes aware of changes in the fair
value of specific properties or property types. The determination of fair value also impacts certain other assets
that are periodically evaluated for impairment using fair value estimates, including goodwill and other
identifiable intangible assets.
Fair value is generally defined as the price that would be received to sell an asset or paid to transfer a
liability (an exit price) as opposed to the price that would be paid to acquire the asset or received to assume the
liability (an entry price), in an orderly transaction between market participants at the measurement date under
current market conditions. While management uses judgment when determining the price at which willing
market participants would transact when there has been a significant decrease in the volume or level of activity
for the asset or liability in relation to “normal” market activity, management’s objective is to determine the point
within the range of fair value estimates that is most representative of a sale to a third-party investor under current
market conditions. The value to the Company if the asset or liability were held to maturity is not included in the
fair value estimates.
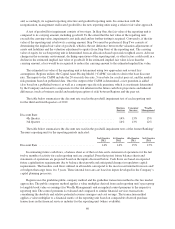
A fair value measure should reflect the assumptions that market participants would use in pricing the asset
or liability, including the assumptions about the risk inherent in a particular valuation technique, the effect of a
restriction on the sale or use of an asset and the risk of nonperformance. Fair value is measured based on a
variety of inputs the Company utilizes. Fair value may be based on quoted market prices for identical assets or
liabilities traded in active markets (Level 1 valuations). If market prices are not available, quoted prices for
identical or similar instruments in markets that are not active and model-based valuation techniques for which all
significant assumptions are observable in the market are used (Level 2 valuations). Where observable market
data is not available, the valuation is generated from model-based techniques that use significant assumptions not
observable in the market, but observable based on Company-specific data (Level 3 valuations). These
unobservable assumptions reflect the Company’s own estimates for assumptions that market participants would
use in pricing the asset or liability. Valuation techniques typically include option pricing models, discounted cash
flow models and similar techniques, but may also include the use of market prices of assets or liabilities that are
not directly comparable to the subject asset or liability.
See Note 1 “Summary of Significant Accounting Policies” to the consolidated financial statements for a
detailed discussion of determining fair value, including pricing validation processes.
Intangible Assets
Regions’ intangible assets consist primarily of the excess of cost over the fair value of net assets of acquired
businesses (“goodwill”) and other identifiable intangible assets (primarily core deposit intangibles and purchased
credit card relationships). Goodwill totaled $4.8 billion at December 31, 2012 and December 31, 2011 and is
allocated to each of Regions’ reportable segments (each a reporting unit), at which level goodwill is tested for
impairment on an annual basis as of October 1 or more often if events and circumstances indicate impairment
may exist (refer to Note 1 “Summary of Significant Accounting Policies” to the consolidated financial statements
for further discussion of when Regions tests goodwill for impairment). As further discussed in Note 22 “Business
Segment Information”, Regions reorganized its management reporting structure during the third quarter of 2012
59