Regions Bank 2012 Annual Report Download - page 93
Download and view the complete annual report
Please find page 93 of the 2012 Regions Bank annual report below. You can navigate through the pages in the report by either clicking on the pages listed below, or by using the keyword search tool below to find specific information within the annual report.-
 1
1 -
2
-
3
-
4
-
5
-
6
-
7
-
8
-
9
-
10
-
11
-
12
-
13
-
14
-
15
-
16
-
17
-
18
-
19
-
20
-
21
-
22
-
23
-
24
-
25
-
26
-
27
-
28
-
29
-
30
-
31
-
32
-
33
-
34
-
35
-
36
-
37
-
38
-
39
-
40
-
41
-
42
-
43
-
44
-
45
-
46
-
47
-
48
-
49
-
50
-
51
-
52
-
53
-
54
-
55
-
56
-
57
-
58
-
59
-
60
-
61
-
62
-
63
-
64
-
65
-
66
-
67
-
68
-
69
-
70
-
71
-
72
-
73
-
74
-
75
-
76
-
77
-
78
-
79
-
80
-
81
-
82
-
 83
83 -
 84
84 -
 85
85 -
 86
86 -
 87
87 -
 88
88 -
 89
89 -
 90
90 -
 91
91 -
 92
92 -
 93
93 -
 94
94 -
 95
95 -
 96
96 -
 97
97 -
 98
98 -
 99
99 -
 100
100 -
 101
101 -
 102
102 -
 103
103 -
104
-
105
-
106
-
107
-
108
-
109
-
110
-
111
-
112
-
113
-
114
-
115
-
116
-
117
-
118
-
119
-
120
-
121
-
122
-
123
-
124
-
125
-
126
-
127
-
128
-
129
-
130
-
131
-
132
-
133
-
134
-
135
-
136
-
137
-
138
-
139
-
140
-
141
-
142
-
143
-
144
-
145
-
146
-
147
-
148
-
149
-
150
-
151
-
152
-
153
-
154
-
155
-
156
-
157
-
158
-
159
-
160
-
161
-
162
-
163
-
164
-
165
-
166
-
167
-
168
-
169
-
170
-
171
-
172
-
173
-
174
-
175
-
176
-
177
-
178
-
179
-
180
-
181
-
182
-
183
-
184
-
185
-
186
-
187
-
188
-
189
-
190
-
191
-
192
-
193
-
194
-
195
-
196
-
197
-
198
-
199
-
200
-
201
-
202
-
203
-
204
-
205
-
206
-
207
-
208
-
209
-
210
-
211
-
212
-
213
-
214
-
215
-
216
-
217
-
218
-
219
-
220
-
221
-
222
-
223
-
224
-
225
-
226
-
227
-
228
-
229
-
230
-
231
-
232
-
233
-
234
-
235
-
236
-
237
-
238
-
239
-
240
-
241
-
242
-
243
-
244
-
245
-
246
-
247
-
248
-
249
-
250
-
251
-
252
-
253
-
254
 |
 |

Loans
GENERAL
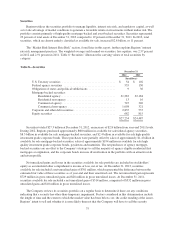
Average loans, net of unearned income, represented 71 percent of average interest-earning assets for the
year ended December 31, 2012, compared to 72 percent for the year ended December 31, 2011. Lending at
Regions is generally organized along three portfolio segments: commercial loans (including commercial and
industrial, and owner occupied commercial real estate mortgage and construction loans), investor real estate
loans (commercial real estate mortgage and construction loans) and consumer loans (residential first mortgage,
home equity, indirect, consumer credit card and other consumer loans).
Regions manages loan growth with a focus on risk management and risk-adjusted return on capital.
Strategic decisions to reduce the concentration in investor real estate, continued run-off of residential mortgage
loans, and lower demand for home equity products were the primary contributors to the decrease. The decrease
was partially offset by increases in commercial and industrial loans and indirect automobile lending.
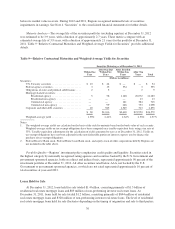
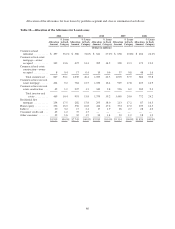
Table 10 illustrates a year-over-year comparison of loans by portfolio segment and class and Table 11
provides information on selected loan maturities.
Table 10—Loan Portfolio
2012 2011 2010 2009 2008
(In millions, net of unearned income)
Commercial and industrial ........................... $26,674 $24,522 $22,540 $21,547 $23,596
Commercial real estate mortgage—owner occupied ....... 10,095 11,166 12,046 12,054 11,722
Commercial real estate construction—owner occupied ..... 302 337 470 751 1,605
Total commercial .............................. 37,071 36,025 35,056 34,352 36,923
Commercial investor real estate mortgage ............... 6,808 9,702 13,621 16,109 14,486
Commercial investor real estate construction ............ 914 1,025 2,287 5,591 9,029
Total investor real estate ........................ 7,722 10,727 15,908 21,700 23,515
Residential first mortgage ........................... 12,963 13,784 14,898 15,632 15,839
Home equity ...................................... 11,800 13,021 14,226 15,381 16,130
Indirect .......................................... 2,336 1,848 1,592 2,452 3,854
Consumer credit card ............................... 906 987 — — —
Other consumer ................................... 1,197 1,202 1,184 1,157 1,158
Total consumer ................................ 29,202 30,842 31,900 34,622 36,981
$73,995 $77,594 $82,864 $90,674 $97,419
77