Regions Bank 2012 Annual Report Download - page 230
Download and view the complete annual report
Please find page 230 of the 2012 Regions Bank annual report below. You can navigate through the pages in the report by either clicking on the pages listed below, or by using the keyword search tool below to find specific information within the annual report.-
 1
1 -
2
-
3
-
4
-
5
-
6
-
7
-
8
-
9
-
10
-
11
-
12
-
13
-
14
-
15
-
16
-
17
-
18
-
19
-
20
-
21
-
22
-
23
-
24
-
25
-
26
-
27
-
28
-
29
-
30
-
31
-
32
-
33
-
34
-
35
-
36
-
37
-
38
-
39
-
40
-
41
-
42
-
43
-
44
-
45
-
46
-
47
-
48
-
49
-
50
-
51
-
52
-
53
-
54
-
55
-
56
-
57
-
58
-
59
-
60
-
61
-
62
-
63
-
64
-
65
-
66
-
67
-
68
-
69
-
70
-
71
-
72
-
73
-
74
-
75
-
76
-
77
-
78
-
79
-
80
-
81
-
82
-
83
-
84
-
85
-
86
-
87
-
88
-
89
-
90
-
91
-
92
-
93
-
94
-
95
-
96
-
97
-
98
-
99
-
100
-
101
-
102
-
103
-
104
-
105
-
106
-
107
-
108
-
109
-
110
-
111
-
112
-
113
-
114
-
115
-
116
-
117
-
118
-
119
-
120
-
121
-
122
-
123
-
124
-
125
-
126
-
127
-
128
-
129
-
130
-
131
-
132
-
133
-
134
-
135
-
136
-
137
-
138
-
139
-
140
-
141
-
142
-
143
-
144
-
145
-
146
-
147
-
148
-
149
-
150
-
151
-
152
-
153
-
154
-
155
-
156
-
157
-
158
-
159
-
160
-
161
-
162
-
163
-
164
-
165
-
166
-
167
-
168
-
169
-
170
-
171
-
172
-
173
-
174
-
175
-
176
-
177
-
178
-
179
-
180
-
181
-
182
-
183
-
184
-
185
-
186
-
187
-
188
-
189
-
190
-
191
-
192
-
193
-
194
-
195
-
196
-
197
-
198
-
199
-
200
-
201
-
202
-
203
-
204
-
205
-
206
-
207
-
208
-
209
-
210
-
211
-
212
-
213
-
214
-
215
-
216
-
217
-
218
-
219
-
 220
220 -
 221
221 -
 222
222 -
 223
223 -
 224
224 -
 225
225 -
 226
226 -
 227
227 -
 228
228 -
 229
229 -
 230
230 -
 231
231 -
 232
232 -
 233
233 -
 234
234 -
 235
235 -
 236
236 -
 237
237 -
 238
238 -
 239
239 -
 240
240 -
241
-
242
-
243
-
244
-
245
-
246
-
247
-
248
-
249
-
250
-
251
-
252
-
253
-
254
 |
 |

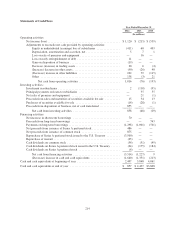
Statements of Cash Flows
Year Ended December 31
2012 2011 2010
(In millions)
Operating activities:
Net income (loss) ................................................. $1,120 $ (215) $ (539)
Adjustments to reconcile net cash provided by operating activities:
Equity in undistributed (earnings) loss of subsidiaries ................ (411) 60 403
Depreciation, amortization and accretion, net ....................... 5 7 1
Loss on sale of premises and equipment ........................... — 16 —
Loss on early extinguishment of debt ............................. 11 — —
Gain on disposition of business .................................. (19) — —
Decrease (increase) in trading assets .............................. 20 6 (4)
(Increase) decrease in other assets ................................ (90) (26) 40
(Decrease) increase in other liabilities ............................ 242 79 (115)
Other ...................................................... 138 (3) 21
Net cash from operating activities ............................ 1,016 (76) (193)
Investing activities:
Investment in subsidiaries .......................................... 2 (110) (95)
Principal payments on loans to subsidiaries ............................ — 35 55
Net sales of premises and equipment ................................. — 21 (1)
Proceeds from sales and maturities of securities available for sale .......... 15 34 13
Purchases of securities available for sale .............................. (14) (28) (1)
Proceeds from disposition of business, net of cash transferred .............. 855 — —
Net cash from investing activities ................................ 858 (48) (29)
Financing activities:
Net increase in short-term borrowings ................................ 70 — —
Proceeds from long-term borrowings ................................. — — 743
Payments on long-term borrowings ................................... (1,298) (1,001) (501)
Net proceeds from issuance of Series A preferred stock ................... 486 — —
Net proceeds from issuance of common stock .......................... 875 — —
Repurchase of Series A preferred stock issued to the U.S. Treasury ......... (3,500) — —
Repurchase of warrant ............................................. (45) — —
Cash dividends on common stock .................................... (54) (51) (49)
Cash dividends on Series A preferred stock issued to the U.S. Treasury ...... (44) (175) (184)
Cash dividends on Series A preferred stock ............................ (4) — —
Net cash from financing activities ................................ (3,514) (1,227) 9
(Decrease) increase in cash and cash equivalents .................... (1,640) (1,351) (213)
Cash and cash equivalents at beginning of year ............................. 2,497 3,848 4,061
Cash and cash equivalents at end of year .................................. $ 857 $2,497 $3,848
214