Regions Bank 2012 Annual Report Download - page 173
Download and view the complete annual report
Please find page 173 of the 2012 Regions Bank annual report below. You can navigate through the pages in the report by either clicking on the pages listed below, or by using the keyword search tool below to find specific information within the annual report.-
 1
1 -
2
-
3
-
4
-
5
-
6
-
7
-
8
-
9
-
10
-
11
-
12
-
13
-
14
-
15
-
16
-
17
-
18
-
19
-
20
-
21
-
22
-
23
-
24
-
25
-
26
-
27
-
28
-
29
-
30
-
31
-
32
-
33
-
34
-
35
-
36
-
37
-
38
-
39
-
40
-
41
-
42
-
43
-
44
-
45
-
46
-
47
-
48
-
49
-
50
-
51
-
52
-
53
-
54
-
55
-
56
-
57
-
58
-
59
-
60
-
61
-
62
-
63
-
64
-
65
-
66
-
67
-
68
-
69
-
70
-
71
-
72
-
73
-
74
-
75
-
76
-
77
-
78
-
79
-
80
-
81
-
82
-
83
-
84
-
85
-
86
-
87
-
88
-
89
-
90
-
91
-
92
-
93
-
94
-
95
-
96
-
97
-
98
-
99
-
100
-
101
-
102
-
103
-
104
-
105
-
106
-
107
-
108
-
109
-
110
-
111
-
112
-
113
-
114
-
115
-
116
-
117
-
118
-
119
-
120
-
121
-
122
-
123
-
124
-
125
-
126
-
127
-
128
-
129
-
130
-
131
-
132
-
133
-
134
-
135
-
136
-
137
-
138
-
139
-
140
-
141
-
142
-
143
-
144
-
145
-
146
-
147
-
148
-
149
-
150
-
151
-
152
-
153
-
154
-
155
-
156
-
157
-
158
-
159
-
160
-
161
-
162
-
 163
163 -
 164
164 -
 165
165 -
 166
166 -
 167
167 -
 168
168 -
 169
169 -
 170
170 -
 171
171 -
 172
172 -
 173
173 -
 174
174 -
 175
175 -
 176
176 -
 177
177 -
 178
178 -
 179
179 -
 180
180 -
 181
181 -
 182
182 -
 183
183 -
184
-
185
-
186
-
187
-
188
-
189
-
190
-
191
-
192
-
193
-
194
-
195
-
196
-
197
-
198
-
199
-
200
-
201
-
202
-
203
-
204
-
205
-
206
-
207
-
208
-
209
-
210
-
211
-
212
-
213
-
214
-
215
-
216
-
217
-
218
-
219
-
220
-
221
-
222
-
223
-
224
-
225
-
226
-
227
-
228
-
229
-
230
-
231
-
232
-
233
-
234
-
235
-
236
-
237
-
238
-
239
-
240
-
241
-
242
-
243
-
244
-
245
-
246
-
247
-
248
-
249
-
250
-
251
-
252
-
253
-
254
 |
 |

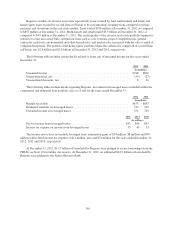
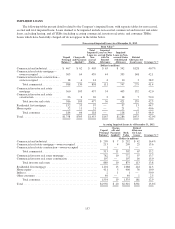
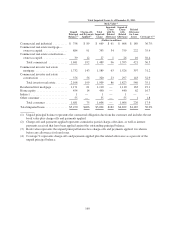
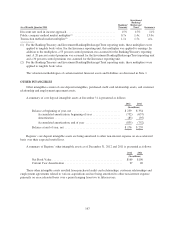
IMPAIRED LOANS
The following tables present details related to the Company’s impaired loans, with separate tables for non-accrual,
accrual and total impaired loans. Loans deemed to be impaired include non-accrual commercial and investor real estate
loans, excluding leasing, and all TDRs (including accruing commercial, investor real estate, and consumer TDRs).
Loans which have been fully charged-off do not appear in the tables below.
Non-accrual Impaired Loans As of December 31, 2012
Book Value(3)
Unpaid
Principal
Balance(1)
Charge-offs
and Payments
Applied(2)
Total
Impaired
Loans on
Non-
accrual
Status
Impaired
Loans on Non-
accrual Status
with No
Related
Allowance
Impaired
Loans on Non-
accrual Status
with Related
Allowance
Related
Allowance for
Loan Losses Coverage %(4)
(Dollars in millions)
Commercial and industrial .......... $ 467 $ 62 $ 405 $ 63 $ 342 $128 40.7%
Commercial real estate mortgage—
owner-occupied ................ 503 64 439 44 395 148 42.1
Commercial real estate construction—
owner-occupied ................ 18 4 14 4 10 3 38.9
Total commercial ............. 988 130 858 111 747 279 41.4
Commercial investor real estate
mortgage ..................... 560 103 457 54 403 132 42.0
Commercial investor real estate
construction ................... 26 6 20 2 18 7 50.0
Total investor real estate ....... 586 109 477 56 421 139 42.3
Residential first mortgage .......... 152 55 97 — 97 13 44.7
Home equity .................... 32 11 21 — 21 2 40.6
Total consumer .............. 184 66 118 — 118 15 44.0
Total ........................... $1,758 $305 $1,453 $167 $1,286 $433 42.0%
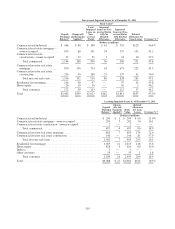
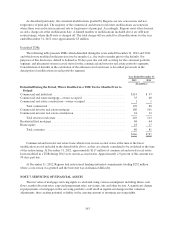
Accruing Impaired Loans As of December 31, 2012
Unpaid
Principal
Balance(1)
Charge-
offs and
Payments
Applied(2)
Book
Value
Related
Allowance
for Loan
Losses Coverage %(4)
(Dollars in millions)
Commercial and industrial .................................... $ 299 $ 7 $ 292 $ 42 16.4%
Commercial real estate mortgage—owner-occupied ................ 213 4 209 25 13.6
Commercial real estate construction—owner-occupied ............. 1 — 1 — —
Total commercial ....................................... 513 11 502 67 15.2
Commercial investor real estate mortgage ........................ 782 10 772 97 13.7
Commercial investor real estate construction ..................... 107 — 107 16 15.0
Total investor real estate ................................. 889 10 879 113 13.8
Residential first mortgage .................................... 1,101 13 1,088 144 14.3
Home equity ............................................... 411 5 406 36 10.0
Indirect ................................................... 2 1 1 — 50.0
Other consumer ............................................ 40 — 40 1 2.5
Total consumer ......................................... 1,554 19 1,535 181 12.9
Total ..................................................... $2,956 $ 40 $2,916 $361 13.6%
157