Regions Bank 2012 Annual Report Download - page 76
Download and view the complete annual report
Please find page 76 of the 2012 Regions Bank annual report below. You can navigate through the pages in the report by either clicking on the pages listed below, or by using the keyword search tool below to find specific information within the annual report.-
 1
1 -
2
-
3
-
4
-
5
-
6
-
7
-
8
-
9
-
10
-
11
-
12
-
13
-
14
-
15
-
16
-
17
-
18
-
19
-
20
-
21
-
22
-
23
-
24
-
25
-
26
-
27
-
28
-
29
-
30
-
31
-
32
-
33
-
34
-
35
-
36
-
37
-
38
-
39
-
40
-
41
-
42
-
43
-
44
-
45
-
46
-
47
-
48
-
49
-
50
-
51
-
52
-
53
-
54
-
55
-
56
-
57
-
58
-
59
-
60
-
61
-
62
-
63
-
64
-
65
-
 66
66 -
 67
67 -
 68
68 -
 69
69 -
 70
70 -
 71
71 -
 72
72 -
 73
73 -
 74
74 -
 75
75 -
 76
76 -
 77
77 -
 78
78 -
 79
79 -
 80
80 -
 81
81 -
 82
82 -
 83
83 -
 84
84 -
 85
85 -
 86
86 -
87
-
88
-
89
-
90
-
91
-
92
-
93
-
94
-
95
-
96
-
97
-
98
-
99
-
100
-
101
-
102
-
103
-
104
-
105
-
106
-
107
-
108
-
109
-
110
-
111
-
112
-
113
-
114
-
115
-
116
-
117
-
118
-
119
-
120
-
121
-
122
-
123
-
124
-
125
-
126
-
127
-
128
-
129
-
130
-
131
-
132
-
133
-
134
-
135
-
136
-
137
-
138
-
139
-
140
-
141
-
142
-
143
-
144
-
145
-
146
-
147
-
148
-
149
-
150
-
151
-
152
-
153
-
154
-
155
-
156
-
157
-
158
-
159
-
160
-
161
-
162
-
163
-
164
-
165
-
166
-
167
-
168
-
169
-
170
-
171
-
172
-
173
-
174
-
175
-
176
-
177
-
178
-
179
-
180
-
181
-
182
-
183
-
184
-
185
-
186
-
187
-
188
-
189
-
190
-
191
-
192
-
193
-
194
-
195
-
196
-
197
-
198
-
199
-
200
-
201
-
202
-
203
-
204
-
205
-
206
-
207
-
208
-
209
-
210
-
211
-
212
-
213
-
214
-
215
-
216
-
217
-
218
-
219
-
220
-
221
-
222
-
223
-
224
-
225
-
226
-
227
-
228
-
229
-
230
-
231
-
232
-
233
-
234
-
235
-
236
-
237
-
238
-
239
-
240
-
241
-
242
-
243
-
244
-
245
-
246
-
247
-
248
-
249
-
250
-
251
-
252
-
253
-
254
 |
 |

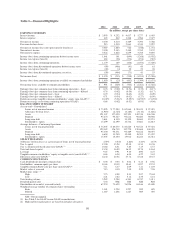
and, accordingly, its segment reporting structure and goodwill reporting units. In connection with the
reorganization, management reallocated goodwill to the new reporting units using a relative fair value approach.
A test of goodwill for impairment consists of two steps. In Step One, the fair value of the reporting unit is
compared to its carrying amount, including goodwill. To the extent that the fair value of the reporting unit
exceeds the carrying value, impairment is not indicated and no further testing is required. Conversely, if the fair
value of the reporting unit is below its carrying amount, Step Two must be performed. Step Two consists of
determining the implied fair value of goodwill, which is the net difference between the valuation adjustments of
assets and liabilities and the valuation adjustment to equity (from Step One) of the reporting unit. The carrying
value of equity for each reporting unit is determined from an allocation based upon risk weighted assets. Adverse
changes in the economic environment, declining operations of the reporting unit, or other factors could result in a
decline in the estimated implied fair value of goodwill. If the estimated implied fair value is less than the
carrying amount, a loss would be recognized to reduce the carrying amount to the estimated implied fair value.
The estimated fair value of the reporting unit is determined using two approaches and several key
assumptions. Regions utilizes the Capital Asset Pricing Model (“CAPM”) in order to derive the base discount
rate. The inputs to the CAPM include the 20-year risk-free rate, 5-year beta for a select peer set, and the market
risk premium based on published data. Once the output of the CAPM is determined, a size premium is added
(also based on a published source) as well as a company-specific risk premium, which is an estimate determined
by the Company and meant to compensate for the risk inherent in the future cash flow projections and inherent
differences (such as business model and market perception of risk) between Regions and the peer set.
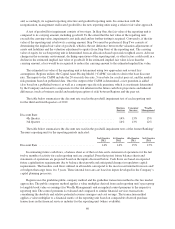
The table below summarizes the discount rate used in the goodwill impairment test of each reporting unit
for the third and fourth quarters of 2012:
Business
Services
Consumer
Services
Wealth
Management
Discount Rate:
4th Quarter .................................................. 14% 13% 13%
3rd Quarter ................................................. 14% 13% 12%
The table below summarizes the discount rate used in the goodwill impairment tests of the former Banking/
Treasury reporting unit for the reporting periods indicated:
2nd Quarter
2012
1st Quarter
2012
4th Quarter
2011
3rd Quarter
2011
Discount Rate ...................................... 14% 14% 15% 15%
In estimating future cash flows, a balance sheet as of the test date and a statement of operations for the last
twelve months of activity for each reporting unit are compiled. From that point, future balance sheets and
statements of operations are projected based on the inputs discussed below. Cash flows are based on expected
future capitalization requirements due to balance sheet growth and anticipated changes in regulatory capital
requirements. The baseline cash flows utilized in all models correspond to the most recent internal forecasts and/
or budgets that range from 1 to 3 years. These internal forecasts are based on inputs developed in the Company’s
capital planning processes.
Regions uses the guideline public company method and the guideline transaction method as the two market
approaches. The public company method applies a value multiplier derived from each reporting unit’s peer group
to tangible book value or earnings (for Wealth Management) and an implied control premium to the respective
reporting unit. The control premium is evaluated and compared to similar financial services transactions
considering the absolute and relative potential revenue synergies and cost savings. The transaction method
applies a value multiplier to a financial metric of the reporting unit based on comparable observed purchase
transactions in the financial services industry for the reporting unit (where available).
60