Regions Bank 2012 Annual Report Download - page 4
Download and view the complete annual report
Please find page 4 of the 2012 Regions Bank annual report below. You can navigate through the pages in the report by either clicking on the pages listed below, or by using the keyword search tool below to find specific information within the annual report.-
 1
1 -
 2
2 -
 3
3 -
 4
4 -
 5
5 -
 6
6 -
 7
7 -
 8
8 -
 9
9 -
 10
10 -
 11
11 -
 12
12 -
 13
13 -
 14
14 -
 15
15 -
16
-
17
-
18
-
19
-
20
-
21
-
22
-
23
-
24
-
25
-
26
-
27
-
28
-
29
-
30
-
31
-
32
-
33
-
34
-
35
-
36
-
37
-
38
-
39
-
40
-
41
-
42
-
43
-
44
-
45
-
46
-
47
-
48
-
49
-
50
-
51
-
52
-
53
-
54
-
55
-
56
-
57
-
58
-
59
-
60
-
61
-
62
-
63
-
64
-
65
-
66
-
67
-
68
-
69
-
70
-
71
-
72
-
73
-
74
-
75
-
76
-
77
-
78
-
79
-
80
-
81
-
82
-
83
-
84
-
85
-
86
-
87
-
88
-
89
-
90
-
91
-
92
-
93
-
94
-
95
-
96
-
97
-
98
-
99
-
100
-
101
-
102
-
103
-
104
-
105
-
106
-
107
-
108
-
109
-
110
-
111
-
112
-
113
-
114
-
115
-
116
-
117
-
118
-
119
-
120
-
121
-
122
-
123
-
124
-
125
-
126
-
127
-
128
-
129
-
130
-
131
-
132
-
133
-
134
-
135
-
136
-
137
-
138
-
139
-
140
-
141
-
142
-
143
-
144
-
145
-
146
-
147
-
148
-
149
-
150
-
151
-
152
-
153
-
154
-
155
-
156
-
157
-
158
-
159
-
160
-
161
-
162
-
163
-
164
-
165
-
166
-
167
-
168
-
169
-
170
-
171
-
172
-
173
-
174
-
175
-
176
-
177
-
178
-
179
-
180
-
181
-
182
-
183
-
184
-
185
-
186
-
187
-
188
-
189
-
190
-
191
-
192
-
193
-
194
-
195
-
196
-
197
-
198
-
199
-
200
-
201
-
202
-
203
-
204
-
205
-
206
-
207
-
208
-
209
-
210
-
211
-
212
-
213
-
214
-
215
-
216
-
217
-
218
-
219
-
220
-
221
-
222
-
223
-
224
-
225
-
226
-
227
-
228
-
229
-
230
-
231
-
232
-
233
-
234
-
235
-
236
-
237
-
238
-
239
-
240
-
241
-
242
-
243
-
244
-
245
-
246
-
247
-
248
-
249
-
250
-
251
-
252
-
253
-
254
 |
 |
REGIONS 2012 ANNUAL REPORT
2
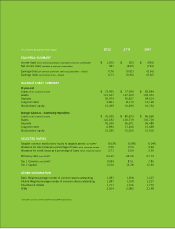
We also strengthened our balance sheet with fewer
problem loans and stronger capital, which further
positions us well for future growth. The improvement
in our asset quality metrics was significant, with
non-performing assets, including assets held for sale,
decreasing 36% year-over-year. At the end of 2012,
non-performing assets stood at $1.9 billion, which
was the lowest level in four years. Our capital position
remains strong as our estimated Tier 1 Capital ratio at
December 31 stood at 12%, and our estimated Tier
1 Common ratio increased approximately 230 basis
points from the end of 2011 to 10.8%.
As positive as this performance was, it also reflected
the challenging economic environment in which we
still operate. We realize that Regions – like the rest
of the industry – must now demonstrate that we can
prudently generate organic growth. We understand
the challenge, and our management team is focused
on moving forward and addressing that challenge.
I am confident that the steps we have taken over the
past three years – and particularly in 2012 – have
positioned Regions to capture more than its share
of growth in 2013 and beyond. We have emerged
from the financial crisis stronger than before, with a
solid capital base and a strong presence in some of
the fastest growing markets in the country. We also
expect Regions and our customers to benefit from
our investments in a single operating platform, which
today gives our associates an integrated view of every
account each customer holds. We believe this is a
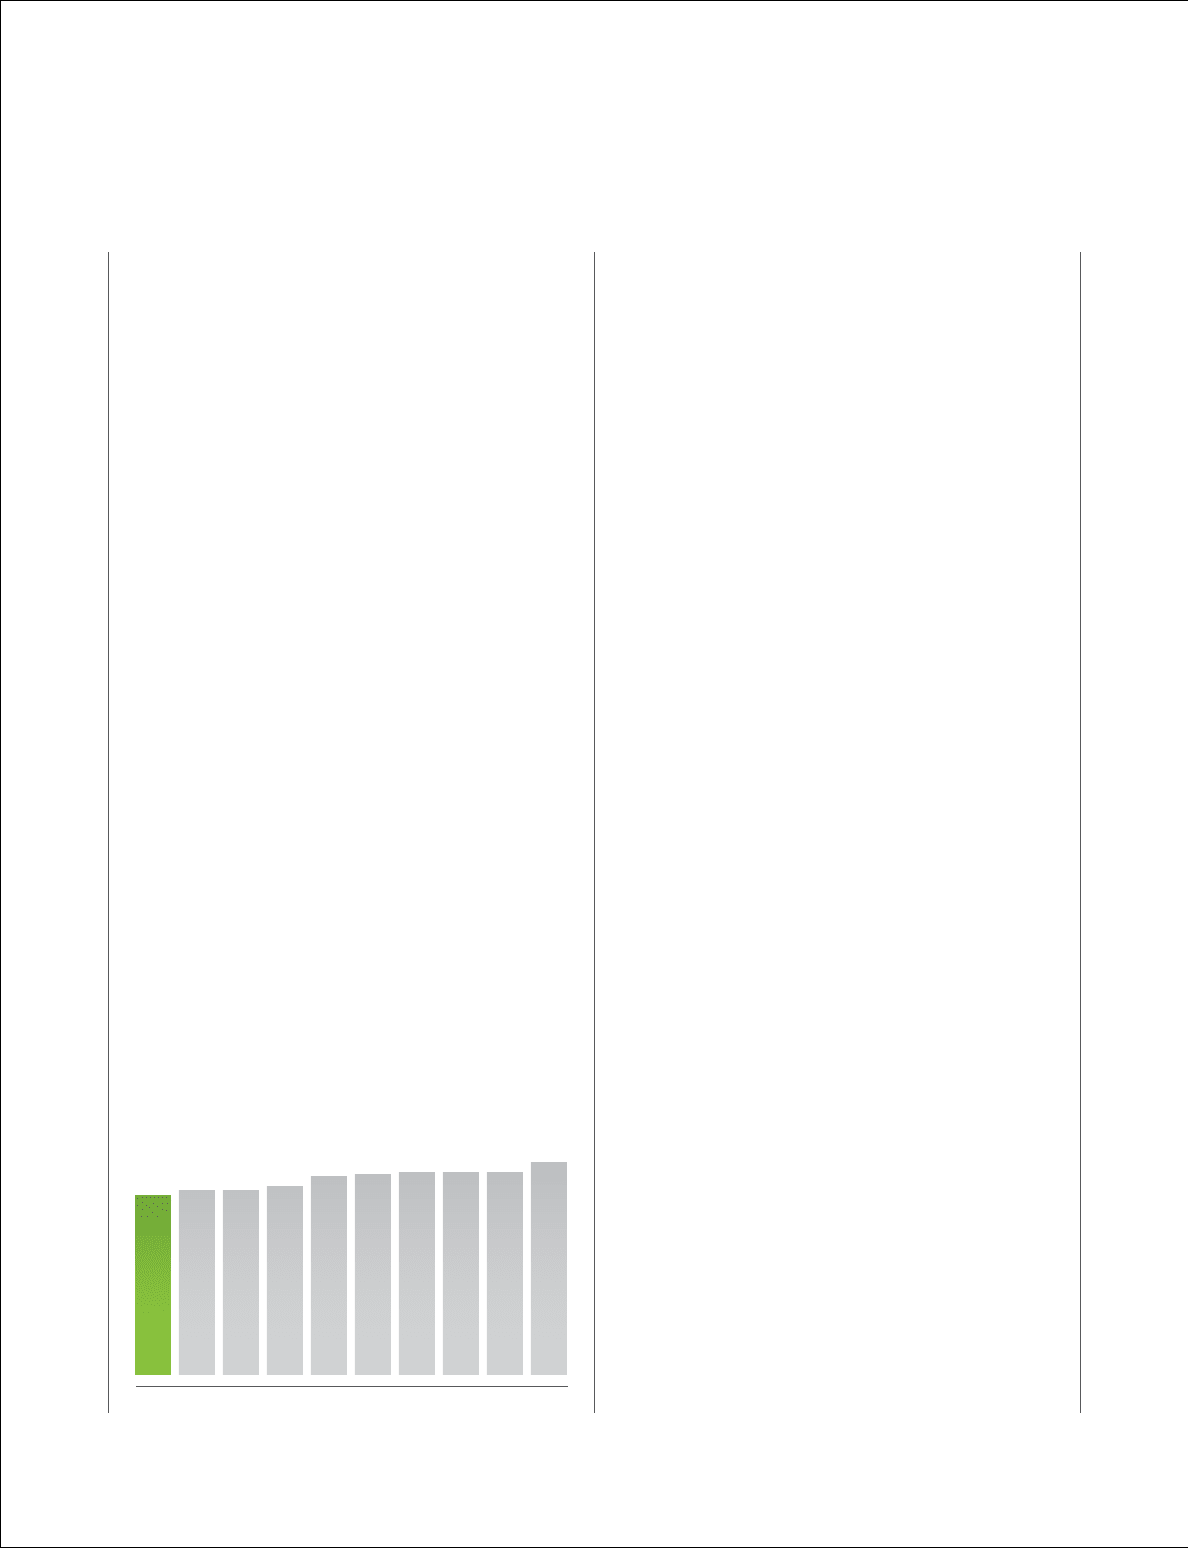
distinct competitive advantage. And, given that our
loan-to-deposit ratio remains relatively low at 78%,
we still have substantial lending capacity to tap as
the economy strengthens and as our customers’
borrowing needs increase.
We raised new equity capital. The Federal Reserve
conducted an industrywide stress test, and Regions
ranked fifth of the 19 banks in its Comprehensive
Capital Analysis and Review. With the markets
showing renewed confidence in banks, we raised
approximately $900 million in new common equity
last March to repay our TARP obligation. In October,
we raised $500 million in preferred stock that also
strengthened regulatory capital, and at the end of
2012, our Tier 1 Common ratio was 10.8%.
We divested Morgan Keegan. In April 2012, we
completed the sale of our brokerage and investment
banking company, Morgan Keegan, to Raymond
James Financial, Inc., for approximately $1.2 billion.
This move gave us the ability to better focus on the
fundamentals of our core business. Following the sale,
we also established the Regions Wealth Management
Group, which provides clients with comprehensive
financial planning, investment and banking solutions,
as well as access to premier investment managers
through our open architecture solution. This strategy
allows us to offer clients a unique value proposition
while providing us with growth potential. But most
importantly, this simplifies our business model and
allows us to focus on serving customers as one team.
We repaid our TARP obligation. In 2008, during the
financial crisis, Regions and many other banks issued
new preferred stock and warrants to the U.S. Treasury
under the Troubled Asset Relief Program (TARP). I
am pleased to report that in April, we completed our
repurchase of the $3.5 billion of Series A Preferred
Stock issued under TARP’s Capital Purchase Program.
The repurchase not only eliminated the payment of
$175 million in annual dividends on these securities,
but it also strengthened our ability to compete more
effectively going forward.
We achieved several milestones in 2012
that put us back in a growth mode:
REGIONS
BANK #2
BANK #3
BANK #5
BANK #4
BANK #6
BANK #7
BANK #8
BANK #9
BANK #10
78% 80% 80% 82% 86% 87% 88% 88% 88% 92%
LOAN TO DEPOSIT RATIO VS. PEERS