Regions Bank 2012 Annual Report Download - page 182
Download and view the complete annual report
Please find page 182 of the 2012 Regions Bank annual report below. You can navigate through the pages in the report by either clicking on the pages listed below, or by using the keyword search tool below to find specific information within the annual report.-
 1
1 -
2
-
3
-
4
-
5
-
6
-
7
-
8
-
9
-
10
-
11
-
12
-
13
-
14
-
15
-
16
-
17
-
18
-
19
-
20
-
21
-
22
-
23
-
24
-
25
-
26
-
27
-
28
-
29
-
30
-
31
-
32
-
33
-
34
-
35
-
36
-
37
-
38
-
39
-
40
-
41
-
42
-
43
-
44
-
45
-
46
-
47
-
48
-
49
-
50
-
51
-
52
-
53
-
54
-
55
-
56
-
57
-
58
-
59
-
60
-
61
-
62
-
63
-
64
-
65
-
66
-
67
-
68
-
69
-
70
-
71
-
72
-
73
-
74
-
75
-
76
-
77
-
78
-
79
-
80
-
81
-
82
-
83
-
84
-
85
-
86
-
87
-
88
-
89
-
90
-
91
-
92
-
93
-
94
-
95
-
96
-
97
-
98
-
99
-
100
-
101
-
102
-
103
-
104
-
105
-
106
-
107
-
108
-
109
-
110
-
111
-
112
-
113
-
114
-
115
-
116
-
117
-
118
-
119
-
120
-
121
-
122
-
123
-
124
-
125
-
126
-
127
-
128
-
129
-
130
-
131
-
132
-
133
-
134
-
135
-
136
-
137
-
138
-
139
-
140
-
141
-
142
-
143
-
144
-
145
-
146
-
147
-
148
-
149
-
150
-
151
-
152
-
153
-
154
-
155
-
156
-
157
-
158
-
159
-
160
-
161
-
162
-
163
-
164
-
165
-
166
-
167
-
168
-
169
-
170
-
171
-
 172
172 -
 173
173 -
 174
174 -
 175
175 -
 176
176 -
 177
177 -
 178
178 -
 179
179 -
 180
180 -
 181
181 -
 182
182 -
 183
183 -
 184
184 -
 185
185 -
 186
186 -
 187
187 -
 188
188 -
 189
189 -
 190
190 -
 191
191 -
 192
192 -
193
-
194
-
195
-
196
-
197
-
198
-
199
-
200
-
201
-
202
-
203
-
204
-
205
-
206
-
207
-
208
-
209
-
210
-
211
-
212
-
213
-
214
-
215
-
216
-
217
-
218
-
219
-
220
-
221
-
222
-
223
-
224
-
225
-
226
-
227
-
228
-
229
-
230
-
231
-
232
-
233
-
234
-
235
-
236
-
237
-
238
-
239
-
240
-
241
-
242
-
243
-
244
-
245
-
246
-
247
-
248
-
249
-
250
-
251
-
252
-
253
-
254
 |
 |

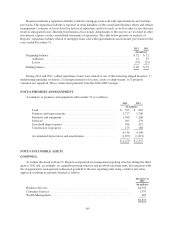
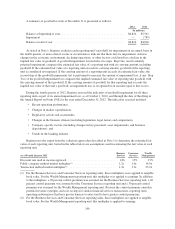
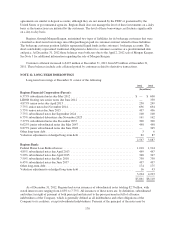
A summary of goodwill activity at December 31 is presented as follows:
2012 2011
(In millions)
Balance at beginning of year ........................................... $4,816 $5,561
Impairment ........................................................ — (745)
Balance at end of year ................................................ $4,816 $4,816
As stated in Note 1, Regions evaluates each reporting unit’s goodwill for impairment on an annual basis in
the fourth quarter, or more often if events or circumstances indicate that there may be impairment. Adverse
changes in the economic environment, declining operations, or other factors could result in a decline in the
implied fair value of goodwill. A goodwill impairment test includes two steps. Step One, used to identify
potential impairment, compares the estimated fair value of a reporting unit with its carrying amount, including
goodwill. If the estimated fair value of a reporting unit exceeds its carrying amount, goodwill of the reporting
unit is considered not impaired. If the carrying amount of a reporting unit exceeds its estimated fair value, the
second step of the goodwill impairment test is performed to measure the amount of impairment loss, if any. Step
Two of the goodwill impairment test compares the implied estimated fair value of reporting unit goodwill with
the carrying amount of that goodwill. If the carrying amount of goodwill for that reporting unit exceeds the
implied fair value of that unit’s goodwill, an impairment loss is recognized in an amount equal to that excess.
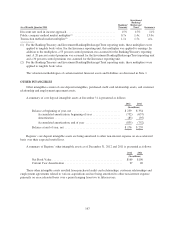
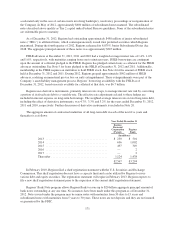
During the fourth quarter of 2012, Regions assessed the indicators of goodwill impairment for all three
reporting units as part of its annual impairment test, as of October 1, 2012, and through the date of the filing of
the Annual Report on Form 10-K for the year ended December 31, 2012. The indicators assessed included:
• Recent operating performance,
• Changes in market capitalization,
• Regulatory actions and assessments,
• Changes in the business climate (including legislation, legal factors and competition),
• Company-specific factors (including changes in key personnel, asset impairments, and business
dispositions), and
• Trends in the banking industry.
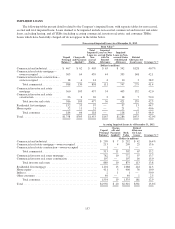
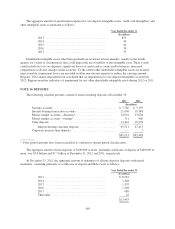
Regions uses the output from the valuation approaches described in Note 1 to determine the estimated fair
value of each reporting unit. Listed in the tables below are assumptions used in estimating the fair value of each
reporting unit.
As of Fourth Quarter 2012
Business
Services
Consumer
Services
Wealth
Management
Discount rate used in income approach ................................ 14% 13% 13%
Public company method market multiplier(1) ........................... 1.2x 1.0x 14.0x
Transaction method market multiplier(2) ............................... 1.3x 1.3x 25.2x
(1) For the Business Services and Consumer Services reporting units, these multipliers were applied to tangible
book value. For the Wealth Management reporting unit, this multiplier was applied to earnings. In addition
to the multipliers, a 20 percent control premium was assumed for the Business Services reporting unit, a 40
percent control premium was assumed for the Consumer Services reporting unit and a 30 percent control
premium was assumed for the Wealth Management reporting unit. Because the control premium considers
potential revenue synergies and cost savings for similar financial services transactions, reporting units
operating in businesses that have greater barriers to entry tend to have greater control premiums.
(2) For the Business Services and Consumer Services reporting units, these multipliers are applied to tangible
book value. For the Wealth Management reporting unit, this multiplier is applied to earnings.
166