Regions Bank 2012 Annual Report Download - page 155
Download and view the complete annual report
Please find page 155 of the 2012 Regions Bank annual report below. You can navigate through the pages in the report by either clicking on the pages listed below, or by using the keyword search tool below to find specific information within the annual report.-
 1
1 -
2
-
3
-
4
-
5
-
6
-
7
-
8
-
9
-
10
-
11
-
12
-
13
-
14
-
15
-
16
-
17
-
18
-
19
-
20
-
21
-
22
-
23
-
24
-
25
-
26
-
27
-
28
-
29
-
30
-
31
-
32
-
33
-
34
-
35
-
36
-
37
-
38
-
39
-
40
-
41
-
42
-
43
-
44
-
45
-
46
-
47
-
48
-
49
-
50
-
51
-
52
-
53
-
54
-
55
-
56
-
57
-
58
-
59
-
60
-
61
-
62
-
63
-
64
-
65
-
66
-
67
-
68
-
69
-
70
-
71
-
72
-
73
-
74
-
75
-
76
-
77
-
78
-
79
-
80
-
81
-
82
-
83
-
84
-
85
-
86
-
87
-
88
-
89
-
90
-
91
-
92
-
93
-
94
-
95
-
96
-
97
-
98
-
99
-
100
-
101
-
102
-
103
-
104
-
105
-
106
-
107
-
108
-
109
-
110
-
111
-
112
-
113
-
114
-
115
-
116
-
117
-
118
-
119
-
120
-
121
-
122
-
123
-
124
-
125
-
126
-
127
-
128
-
129
-
130
-
131
-
132
-
133
-
134
-
135
-
136
-
137
-
138
-
139
-
140
-
141
-
142
-
143
-
144
-
 145
145 -
 146
146 -
 147
147 -
 148
148 -
 149
149 -
 150
150 -
 151
151 -
 152
152 -
 153
153 -
 154
154 -
 155
155 -
 156
156 -
 157
157 -
 158
158 -
 159
159 -
 160
160 -
 161
161 -
 162
162 -
 163
163 -
 164
164 -
 165
165 -
166
-
167
-
168
-
169
-
170
-
171
-
172
-
173
-
174
-
175
-
176
-
177
-
178
-
179
-
180
-
181
-
182
-
183
-
184
-
185
-
186
-
187
-
188
-
189
-
190
-
191
-
192
-
193
-
194
-
195
-
196
-
197
-
198
-
199
-
200
-
201
-
202
-
203
-
204
-
205
-
206
-
207
-
208
-
209
-
210
-
211
-
212
-
213
-
214
-
215
-
216
-
217
-
218
-
219
-
220
-
221
-
222
-
223
-
224
-
225
-
226
-
227
-
228
-
229
-
230
-
231
-
232
-
233
-
234
-
235
-
236
-
237
-
238
-
239
-
240
-
241
-
242
-
243
-
244
-
245
-
246
-
247
-
248
-
249
-
250
-
251
-
252
-
253
-
254
 |
 |
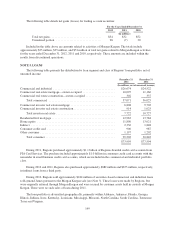
Trading account assets and liabilities and securities available for sale consist of U.S. Treasuries,
obligations of states and political subdivisions, mortgage-backed securities (including agency securities), other
debt securities and equity securities.
• U.S. Treasuries are valued based on quoted market prices of identical assets on active exchanges (Level
1 measurements as described above) and also using data from third-party pricing services for similar
securities as applicable. Pricing from these third party services is generally based on a market approach
using observable inputs such as benchmark yields, reported trades, broker/dealer quotes, benchmark
securities, bid and offers. These valuations are Level 2 measurements.
• Mortgage-backed securities are valued primarily using data from third-party pricing services for similar
securities as applicable. Pricing from these third-party services is generally based on a market approach
using observable inputs such as benchmark yields, reported trades, broker/dealer quotes, benchmark
securities, to be announced (“TBA”) prices, issuer spreads, bids and offers, monthly payment
information, and collateral performance, as applicable. These valuations are Level 2 measurements.
Where such comparable data is not available, the Company develops valuations based on assumptions
that are not readily observable in the market place; these valuations are Level 3 measurements.
• Obligations of states and political subdivisions are generally based on data from third-party pricing
services. The valuations are based on a market approach using observable inputs such as benchmark
yields, Municipal Securities Rulemaking Board (“MSRB”) reported trades, material event notices and
new issue data. These valuations are Level 2 measurements. Where such comparable data is not
available, the Company develops valuations based on assumptions that are not readily observable in the
market place; these valuations are Level 3 measurements. For example, auction-rate securities fall into
this category. For these instruments, internal pricing models assume converting the securities into
fixed-rate debt securities with similar credit ratings and maturity dates based on management’s
estimates of the term of the securities. Assumed terms generally fall within a range of one to four years.
• Other debt securities are valued based on Level 1, 2 and 3 measurements, depending on pricing
methodology selected and are valued primarily using data from third-party pricing services. Pricing
from these third-party pricing services is generally based on a market approach using observable inputs
such as benchmark yields, reported trades, broker/dealer quotes, issuer spreads, benchmark securities,
bids and offers, and Trade Reporting and Compliance Engine (“TRACE”) reported trades.
• Equity securities are valued based on quoted market prices of identical assets on active exchanges;
these valuations are Level 1 measurements.
A portion of Regions’ trading account assets and the majority of trading liabilities and securities available
for sale are valued using third-party pricing services. To validate pricing related to investment securities held in
the trading account assets and liabilities portfolios, pricing received from third-party pricing services is compared
to available market data for reasonableness and/or pricing information from other third-party pricing services.
Insignificant pricing adjustments may be made by traders to individual securities based upon the trader’s opinion
of value. When such adjustments are made, Regions classifies the measurement as a Level 3 measurement.
To validate pricing related to liquid investment securities, which represent the vast majority of the available
for sale portfolio (e.g., mortgage-backed securities), Regions compares price changes received from the pricing
service to overall changes in market factors in order to validate the pricing received. To validate pricing received
on less liquid investment securities in the available for sale portfolio, Regions receives pricing from third-party
brokers/dealers on a sample of securities that are then compared to the pricing received. The pricing service uses
standard observable inputs when available, for example: benchmark yields, reported trades, broker-dealer quotes,
issuer spreads, benchmark securities, and bids and offers, among others. For certain security types, additional
inputs may be used, or some inputs may not be applicable. It is not customary for Regions to adjust the pricing
received for the available for sale portfolio. In the event that prices are adjusted, Regions classifies the
measurement as a Level 3 measurement.
139