Regions Bank 2012 Annual Report Download - page 105
Download and view the complete annual report
Please find page 105 of the 2012 Regions Bank annual report below. You can navigate through the pages in the report by either clicking on the pages listed below, or by using the keyword search tool below to find specific information within the annual report.-
 1
1 -
2
-
3
-
4
-
5
-
6
-
7
-
8
-
9
-
10
-
11
-
12
-
13
-
14
-
15
-
16
-
17
-
18
-
19
-
20
-
21
-
22
-
23
-
24
-
25
-
26
-
27
-
28
-
29
-
30
-
31
-
32
-
33
-
34
-
35
-
36
-
37
-
38
-
39
-
40
-
41
-
42
-
43
-
44
-
45
-
46
-
47
-
48
-
49
-
50
-
51
-
52
-
53
-
54
-
55
-
56
-
57
-
58
-
59
-
60
-
61
-
62
-
63
-
64
-
65
-
66
-
67
-
68
-
69
-
70
-
71
-
72
-
73
-
74
-
75
-
76
-
77
-
78
-
79
-
80
-
81
-
82
-
83
-
84
-
85
-
86
-
87
-
88
-
89
-
90
-
91
-
92
-
93
-
94
-
 95
95 -
 96
96 -
 97
97 -
 98
98 -
 99
99 -
 100
100 -
 101
101 -
 102
102 -
 103
103 -
 104
104 -
 105
105 -
 106
106 -
 107
107 -
 108
108 -
 109
109 -
 110
110 -
 111
111 -
 112
112 -
 113
113 -
 114
114 -
 115
115 -
116
-
117
-
118
-
119
-
120
-
121
-
122
-
123
-
124
-
125
-
126
-
127
-
128
-
129
-
130
-
131
-
132
-
133
-
134
-
135
-
136
-
137
-
138
-
139
-
140
-
141
-
142
-
143
-
144
-
145
-
146
-
147
-
148
-
149
-
150
-
151
-
152
-
153
-
154
-
155
-
156
-
157
-
158
-
159
-
160
-
161
-
162
-
163
-
164
-
165
-
166
-
167
-
168
-
169
-
170
-
171
-
172
-
173
-
174
-
175
-
176
-
177
-
178
-
179
-
180
-
181
-
182
-
183
-
184
-
185
-
186
-
187
-
188
-
189
-
190
-
191
-
192
-
193
-
194
-
195
-
196
-
197
-
198
-
199
-
200
-
201
-
202
-
203
-
204
-
205
-
206
-
207
-
208
-
209
-
210
-
211
-
212
-
213
-
214
-
215
-
216
-
217
-
218
-
219
-
220
-
221
-
222
-
223
-
224
-
225
-
226
-
227
-
228
-
229
-
230
-
231
-
232
-
233
-
234
-
235
-
236
-
237
-
238
-
239
-
240
-
241
-
242
-
243
-
244
-
245
-
246
-
247
-
248
-
249
-
250
-
251
-
252
-
253
-
254
 |
 |
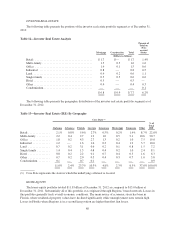
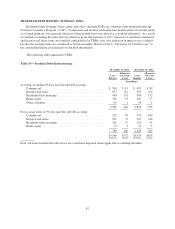
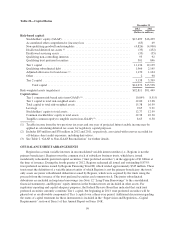
Non-performing assets totaled $1.9 billion at December 31, 2012, compared to $3.0 billion at December 31,
2011. Foreclosed properties, a subset of non-performing assets, totaled $149 million and $296 million at
December 31, 2012 and December 31, 2011, respectively. The decrease in non-performing assets and foreclosed
properties during 2012 reflects the Company’s efforts to work through problem assets and reduce the riskiest
exposures.
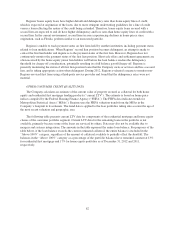
Based on current expectations for the economy, non-performing assets are expected to improve in 2013
compared to 2012. Economic trends such as real estate valuations, interest rates and unemployment, as well as
the level of disposition activity, will impact the future level of non-performing assets. Circumstances related to
individually large credits may result in volatility throughout 2013.
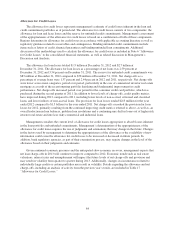
Loans past due 90 days or more and still accruing were $450 million at December 31, 2012, a slight increase
from $447 million at December 31, 2011.
At December 31, 2012, Regions had approximately $250-$350 million of potential problem commercial and
investor real estate loans that were not included in non-accrual loans, but for which management had concerns as
to the ability of such borrowers to comply with their present loan repayment terms. This is a likely estimate of
the amount of commercial and investor real estate loans that may migrate to non-accrual status in the next
quarter.
In order to arrive at the estimate of potential problem loans, personnel from geographic regions forecast
certain larger dollar loans that may potentially be downgraded to non-accrual at a future time, depending on the
occurrence of future events. These personnel consider a variety of factors, including the borrower’s capacity and
willingness to meet the contractual repayment terms, make principal curtailments or provide additional collateral
when necessary, and provide current and complete financial information including global cash flows, contingent
liabilities and sources of liquidity. A probability weighting is assigned to the listing of loans due to the inherent
level of uncertainty related to potential actions that a borrower or guarantor may take to prevent the loan from
reaching problem status. Regions assigns the probability weighting based on an assessment of the likelihood that
the necessary actions required to prevent problem loan status will occur. Additionally, for other loans (for
example, smaller dollar loans), a factor based on trends and experience is applied to determine the estimate of
potential future downgrades. Because of the inherent uncertainty in forecasting future events, the estimate of
potential problem loans ultimately represents the estimated aggregate dollar amounts of loans as opposed to an
individual listing of loans.
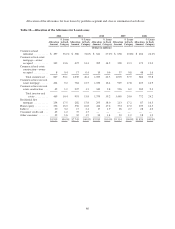
The majority of the loans on which the potential problem loan estimate is based are classified as substandard
accrual. Detailed disclosures for substandard accrual loans (as well as other credit quality metrics) are included in
Note 6 “Allowance for Credit Losses” to the consolidated financial statements.
89