Regions Bank 2012 Annual Report Download - page 166
Download and view the complete annual report
Please find page 166 of the 2012 Regions Bank annual report below. You can navigate through the pages in the report by either clicking on the pages listed below, or by using the keyword search tool below to find specific information within the annual report.-
 1
1 -
2
-
3
-
4
-
5
-
6
-
7
-
8
-
9
-
10
-
11
-
12
-
13
-
14
-
15
-
16
-
17
-
18
-
19
-
20
-
21
-
22
-
23
-
24
-
25
-
26
-
27
-
28
-
29
-
30
-
31
-
32
-
33
-
34
-
35
-
36
-
37
-
38
-
39
-
40
-
41
-
42
-
43
-
44
-
45
-
46
-
47
-
48
-
49
-
50
-
51
-
52
-
53
-
54
-
55
-
56
-
57
-
58
-
59
-
60
-
61
-
62
-
63
-
64
-
65
-
66
-
67
-
68
-
69
-
70
-
71
-
72
-
73
-
74
-
75
-
76
-
77
-
78
-
79
-
80
-
81
-
82
-
83
-
84
-
85
-
86
-
87
-
88
-
89
-
90
-
91
-
92
-
93
-
94
-
95
-
96
-
97
-
98
-
99
-
100
-
101
-
102
-
103
-
104
-
105
-
106
-
107
-
108
-
109
-
110
-
111
-
112
-
113
-
114
-
115
-
116
-
117
-
118
-
119
-
120
-
121
-
122
-
123
-
124
-
125
-
126
-
127
-
128
-
129
-
130
-
131
-
132
-
133
-
134
-
135
-
136
-
137
-
138
-
139
-
140
-
141
-
142
-
143
-
144
-
145
-
146
-
147
-
148
-
149
-
150
-
151
-
152
-
153
-
154
-
155
-
 156
156 -
 157
157 -
 158
158 -
 159
159 -
 160
160 -
 161
161 -
 162
162 -
 163
163 -
 164
164 -
 165
165 -
 166
166 -
 167
167 -
 168
168 -
 169
169 -
 170
170 -
 171
171 -
 172
172 -
 173
173 -
 174
174 -
 175
175 -
 176
176 -
177
-
178
-
179
-
180
-
181
-
182
-
183
-
184
-
185
-
186
-
187
-
188
-
189
-
190
-
191
-
192
-
193
-
194
-
195
-
196
-
197
-
198
-
199
-
200
-
201
-
202
-
203
-
204
-
205
-
206
-
207
-
208
-
209
-
210
-
211
-
212
-
213
-
214
-
215
-
216
-
217
-
218
-
219
-
220
-
221
-
222
-
223
-
224
-
225
-
226
-
227
-
228
-
229
-
230
-
231
-
232
-
233
-
234
-
235
-
236
-
237
-
238
-
239
-
240
-
241
-
242
-
243
-
244
-
245
-
246
-
247
-
248
-
249
-
250
-
251
-
252
-
253
-
254
 |
 |

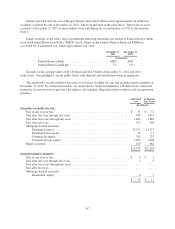
Regions considers its investor real estate (specifically loans secured by land, multi-family and retail) and
home equity loans secured by second liens in Florida to be concentrations resulting from continued economic
pressures and downturns in the real estate market. Land totaled $558 million at December 31, 2012 as compared
to $857 million at December 31, 2011. Multi-family and retail totaled $3.3 billion at December 31, 2012 as
compared to $4.9 billion at December 31, 2011. The credit quality of the investor real estate portfolio segment is
sensitive to risks associated with construction loans such as cost overruns, project completion risk, general
contractor credit risk, environmental and other hazard risks, and market risks associated with the sale or rental of
completed properties. The portion of the home equity portfolio where the collateral is comprised of second liens
in Florida was $2.4 billion and $2.8 billion at December 31, 2012 and 2011, respectively.
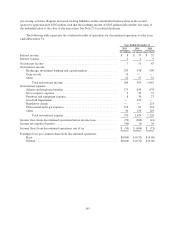
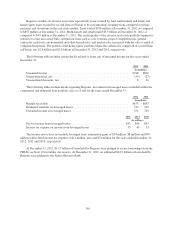
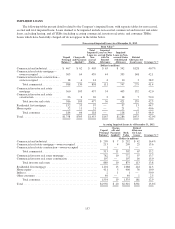
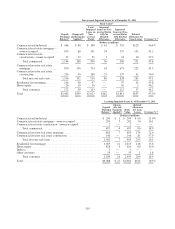
The following table includes certain details related to loans, net of unearned income for the years ended
December 31:
2012 2011
(In millions)
Unearned income ....................................................... $748 $870
Unamortized fees, net ................................................... (55) (27)
Unamortized discounts, net ............................................... 8 21
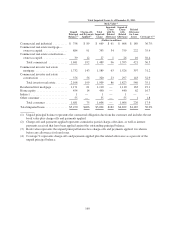
The following tables include details regarding Regions’ investment in leveraged leases included within the
commercial and industrial loan portfolio class as of and for the years ended December 31:
2012 2011
(In millions)
Rentals receivable ...................................................... $673 $855
Estimated residuals on leveraged leases ..................................... 312 315
Unearned income on leveraged leases ...................................... 551 703
2012 2011 2010
(In millions)
Pre-tax income from leveraged leases .................................. $43 $46 $67
Income tax expense on income from leveraged leases ..................... 35 45 53
The income above does not include leveraged lease termination gains of $14 million, $8 million and $78
million with related income tax expense of $11 million, zero and $74 million for the years ended December 31,
2012, 2011 and 2010, respectively.
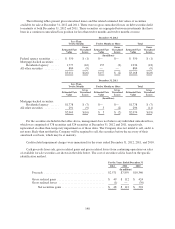
At December 31, 2012, $11.5 billion of loans held by Regions were pledged to secure borrowings from the
FHLB (see Note 12 for further discussion). At December 31, 2012, an additional $24.9 billion of loans held by
Regions were pledged to the Federal Reserve Bank.
150