Bank of America 2008 Annual Report Download - page 100
Download and view the complete annual report
Please find page 100 of the 2008 Bank of America annual report below. You can navigate through the pages in the report by either clicking on the pages listed below, or by using the keyword search tool below to find specific information within the annual report.-
 1
1 -
2
-
3
-
4
-
5
-
6
-
7
-
8
-
9
-
10
-
11
-
12
-
13
-
14
-
15
-
16
-
17
-
18
-
19
-
20
-
21
-
22
-
23
-
24
-
25
-
26
-
27
-
28
-
29
-
30
-
31
-
32
-
33
-
34
-
35
-
36
-
37
-
38
-
39
-
40
-
41
-
42
-
43
-
44
-
45
-
46
-
47
-
48
-
49
-
50
-
51
-
52
-
53
-
54
-
55
-
56
-
57
-
58
-
59
-
60
-
61
-
62
-
63
-
64
-
65
-
66
-
67
-
68
-
69
-
70
-
71
-
72
-
73
-
74
-
75
-
76
-
77
-
78
-
79
-
80
-
81
-
82
-
83
-
84
-
85
-
86
-
87
-
88
-
89
-
 90
90 -
 91
91 -
 92
92 -
 93
93 -
 94
94 -
 95
95 -
 96
96 -
 97
97 -
 98
98 -
 99
99 -
 100
100 -
 101
101 -
 102
102 -
 103
103 -
 104
104 -
 105
105 -
 106
106 -
 107
107 -
 108
108 -
 109
109 -
 110
110 -
111
-
112
-
113
-
114
-
115
-
116
-
117
-
118
-
119
-
120
-
121
-
122
-
123
-
124
-
125
-
126
-
127
-
128
-
129
-
130
-
131
-
132
-
133
-
134
-
135
-
136
-
137
-
138
-
139
-
140
-
141
-
142
-
143
-
144
-
145
-
146
-
147
-
148
-
149
-
150
-
151
-
152
-
153
-
154
-
155
-
156
-
157
-
158
-
159
-
160
-
161
-
162
-
163
-
164
-
165
-
166
-
167
-
168
-
169
-
170
-
171
-
172
-
173
-
174
-
175
-
176
-
177
-
178
-
179
-
180
-
181
-
182
-
183
-
184
-
185
-
186
-
187
-
188
-
189
-
190
-
191
-
192
-
193
-
194
-
195
 |
 |
incentive compensation within GCIB. Merger and restructuring charges
decreased mainly due to the declining integration costs associated with
the MBNA acquisition partially offset by costs associated with the
integration of U.S. Trust Corporation and LaSalle.
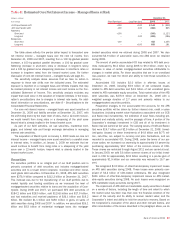
Income Tax Expense
Income tax expense was $5.9 billion in 2007 compared to $10.8 billion
in 2006, resulting in effective tax rates of 28.4 percent in 2007 and 33.9
percent in 2006. The decrease in the effective tax rate was primarily due
to lower pre-tax income, a one-time tax benefit from restructuring our
existing non-U.S. based commercial aircraft leasing business and an
increase in the relative percentage of our earnings taxed solely outside of
the U.S.
Business Segment Operations
Global Consumer and Small Business Banking
Net income decreased $2.1 billion, or 18 percent, to $9.4 billion com-
pared to 2006 as increases in noninterest income and net interest
income were more than offset by increases in provision for credit losses
and noninterest expense. Net interest income increased $653 million, or
two percent, to $28.7 billion due to the impacts of organic growth and the
LaSalle acquisition on average loans and leases, and deposits compared
to 2006. Noninterest income increased $2.4 billion, or 14 percent, to
$19.1 billion compared to the same period in 2006, mainly due to
increases in card income of $823 million, service charges of $663 mil-
lion and mortgage banking income of $413 million. Provision for credit
losses increased $4.4 billion, or 52 percent, to $12.9 billion compared to
2006 primarily driven by higher Card Services managed net losses from
portfolio seasoning and increases from unusually low loss levels experi-
enced in 2006 post bankruptcy reform. In addition the increase was
driven by higher losses inherent in the home equity portfolio reflective of
portfolio seasoning and the impacts of the weak housing market, partic-
ularly in geographic areas which have experienced the most significant
home price declines driving a reduction in collateral value. Noninterest
expense increased $2.2 billion, or 12 percent, to $20.3 billion largely
due to increases in personnel-related expenses, certain Visa-related
costs, equally allocated to Card Services and Treasury Services on a
management accounting basis, and technology-related costs.
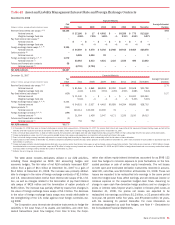
Global Corporate and Investment Banking
Net income decreased $5.5 billion, or 91 percent, to $510 million and
total revenue decreased $7.7 billion, or 36 percent, to $13.7 billion
compared to 2006. These decreases were driven by $5.6 billion of
losses resulting from our CDO exposure and other trading losses. Addi-
tionally, we experienced increases in provision for credit losses and non-
interest expense, which were partially offset by an increase in net interest
income. Net interest income increased $1.3 billion, or 13 percent, to
$11.2 billion due to higher market-based net interest income and the FTE
impact of a one-time tax benefit from restructuring our existing non-U.S.
based commercial aircraft leasing business. Noninterest income
decreased $9.0 billion, or 79 percent, to $2.4 billion compared to 2006,
driven by the losses from our CDO exposure and other trading losses.
Provision for credit losses was $658 million in 2007 compared to $6 mil-
lion in 2006. The increase was driven by the absence of 2006 releases
of reserves, higher net charge-offs and an increase in reserves during
2007 reflecting the impact of the weak housing market particularly on the
homebuilder loan portfolio. Noninterest expense increased $321 million,
or three percent, to $12.2 billion compared to 2006 mainly due to the
addition of LaSalle and certain Visa-related costs, equally allocated to
Treasury Services and Card Services on a management accounting basis,
partially offset by a reduction in performance-based incentive compensa-
tion in CMAS.
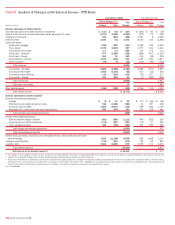
Global Wealth and Investment Management
Net income decreased $182 million, or eight percent, to $2.0 billion
compared to 2006, due mainly to losses associated with the support
provided to certain cash funds managed within Columbia and an increase
in noninterest expense. Net interest income increased $163 million, or
four percent, to $3.9 billion driven by the impact of the U.S. Trust Corpo-
ration acquisition and organic growth in average deposit and loan balan-
ces. Noninterest income increased $306 million, or nine percent, to $3.6
billion driven by an increase in investment and brokerage services primar-
ily due to higher AUM attributable to the impact of the U.S. Trust Corpo-
ration acquisition, net client inflows and favorable market conditions
combined with an increase in brokerage activity. Partially offsetting this
increase was a decrease in all other income due to losses associated
with support provided to certain cash funds. Noninterest expense
increased $756 million, or 20 percent, to $4.5 billion driven by the addi-
tion of U.S. Trust Corporation, higher revenue related expenses and
increased marketing costs.
All Other
Net income increased $1.6 billion, or 101 percent, to $3.2 billion com-
pared to 2006. Excluding the securitization offset this increase was due
to higher noninterest income combined with decreases in all other non-
interest expense, merger and restructuring charges and provision for
credit losses partially offset by a decrease in net interest income. Net
interest income decreased $1.3 billion, or 77 percent, to $382 million
compared to 2006 resulting largely from the absence of net interest
income due to the sale of the Latin American operations and Hong Kong-
based retail and commercial banking business which were included in our
2006 results. Noninterest income increased $1.7 billion, or 70 percent,
to $4.1 billion driven by the $1.5 billion gain from the sale of Marsico. In
addition, noninterest income increased due to higher equity investment
income and the absence of a loss on the sale of mortgage backed debt
securities which occurred in the prior year. The provision for credit losses
decreased $135 million to negative $248 million mainly due to reserve
reductions from the sale of our Argentina portfolio during the first quarter
of 2007. Merger and restructuring charges decreased $395 million, or 49
percent, to $410 million due to declining integration costs associated
with the integration of the MBNA acquisition partially offset by costs
associated with U.S. Trust Corporation and LaSalle. The decrease in
other noninterest expense of $1.1 billion was driven by the absence of
operating costs after the sale of the Latin American operations and Hong
Kong-based retail and commercial banking business which were included
in our 2006 results.
98
Bank of America 2008