Bank of America 2008 Annual Report Download - page 101
Download and view the complete annual report
Please find page 101 of the 2008 Bank of America annual report below. You can navigate through the pages in the report by either clicking on the pages listed below, or by using the keyword search tool below to find specific information within the annual report.-
 1
1 -
2
-
3
-
4
-
5
-
6
-
7
-
8
-
9
-
10
-
11
-
12
-
13
-
14
-
15
-
16
-
17
-
18
-
19
-
20
-
21
-
22
-
23
-
24
-
25
-
26
-
27
-
28
-
29
-
30
-
31
-
32
-
33
-
34
-
35
-
36
-
37
-
38
-
39
-
40
-
41
-
42
-
43
-
44
-
45
-
46
-
47
-
48
-
49
-
50
-
51
-
52
-
53
-
54
-
55
-
56
-
57
-
58
-
59
-
60
-
61
-
62
-
63
-
64
-
65
-
66
-
67
-
68
-
69
-
70
-
71
-
72
-
73
-
74
-
75
-
76
-
77
-
78
-
79
-
80
-
81
-
82
-
83
-
84
-
85
-
86
-
87
-
88
-
89
-
90
-
 91
91 -
 92
92 -
 93
93 -
 94
94 -
 95
95 -
 96
96 -
 97
97 -
 98
98 -
 99
99 -
 100
100 -
 101
101 -
 102
102 -
 103
103 -
 104
104 -
 105
105 -
 106
106 -
 107
107 -
 108
108 -
 109
109 -
 110
110 -
 111
111 -
112
-
113
-
114
-
115
-
116
-
117
-
118
-
119
-
120
-
121
-
122
-
123
-
124
-
125
-
126
-
127
-
128
-
129
-
130
-
131
-
132
-
133
-
134
-
135
-
136
-
137
-
138
-
139
-
140
-
141
-
142
-
143
-
144
-
145
-
146
-
147
-
148
-
149
-
150
-
151
-
152
-
153
-
154
-
155
-
156
-
157
-
158
-
159
-
160
-
161
-
162
-
163
-
164
-
165
-
166
-
167
-
168
-
169
-
170
-
171
-
172
-
173
-
174
-
175
-
176
-
177
-
178
-
179
-
180
-
181
-
182
-
183
-
184
-
185
-
186
-
187
-
188
-
189
-
190
-
191
-
192
-
193
-
194
-
195
 |
 |

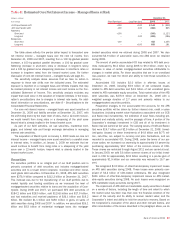
Statistical Tables
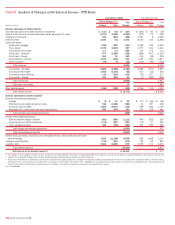
Table I Year-to-date Average Balances and Interest Rates – FTE Basis
2008 2007 2006
(1)
(Dollars in millions)
Average
Balance
Interest
Income/
Expense
Yield/
Rate
Average
Balance
Interest
Income/
Expense
Yield/
Rate
Average
Balance
Interest
Income/
Expense
Yield/
Rate
Earning assets
Time deposits placed and other short-term investments
$ 10,696 $ 440 4.11%
$ 13,152 $ 627 4.77% $ 15,611 $ 646 4.14%
Federal funds sold and securities purchased under agreements to
resell
128,053 3,313 2.59
155,828 7,722 4.96 175,334 7,823 4.46
Trading account assets
193,631 9,259 4.78
187,287 9,747 5.20 145,321 7,552 5.20
Debt securities
(2)
250,551 13,383 5.34
186,466 10,020 5.37 225,219 11,845 5.26
Loans and leases
(3)
:
Residential mortgage
260,213 14,671 5.64
264,650 15,112 5.71 207,879 11,608 5.58
Home equity
135,091 7,592 5.62
98,765 7,385 7.48 78,318 5,772 7.37
Discontinued real estate
10,898 858 7.87
n/a n/a n/a n/a n/a n/a
Credit card – domestic
63,318 6,843 10.81
57,883 7,225 12.48 63,838 8,638 13.53
Credit card – foreign
16,527 2,042 12.36
12,359 1,502 12.15 9,141 1,147 12.55
Direct/Indirect consumer
(4)
82,516 6,934 8.40
70,009 6,002 8.57 53,172 4,185 7.87
Other consumer
(5)
3,816 321 8.41
4,510 389 8.64 7,516 789 10.50
Total consumer
572,379 39,261 6.86
508,176 37,615 7.40 419,864 32,139 7.65
Commercial – domestic
220,561 11,702 5.31
180,102 12,884 7.15 151,231 10,897 7.21
Commercial real estate
(6)
63,208 3,057 4.84
42,950 3,145 7.32 36,939 2,740 7.42
Commercial lease financing
22,290 799 3.58
20,435 1,212 5.93 20,862 995 4.77
Commercial – foreign
32,440 1,503 4.63
24,491 1,452 5.93 23,521 1,674 7.12
Total commercial
338,499 17,061 5.04
267,978 18,693 6.98 232,553 16,306 7.01
Total loans and leases
910,878 56,322 6.18
776,154 56,308 7.25 652,417 48,445 7.43
Other earning assets
68,920 4,161 6.04
71,305 4,629 6.49 55,242 3,498 6.33
Total earning assets (7)
1,562,729 86,878 5.56
1,390,192 89,053 6.41 1,269,144 79,809 6.29
Cash and cash equivalents
45,354
33,091 34,052
Other assets, less allowance for loan and lease losses
235,896
178,790 163,485
Total assets
$1,843,979
$1,602,073 $1,466,681
Interest-bearing liabilities
Domestic interest-bearing deposits:
Savings
$ 32,204 $ 230 0.71%
$ 32,316 $ 188 0.58% $ 34,608 $ 269 0.78%
NOW and money market deposit accounts
267,818 3,781 1.41
220,207 4,361 1.98 218,077 3,923 1.80
Consumer CDs and IRAs
203,887 7,404 3.63
167,801 7,817 4.66 144,738 6,022 4.16
Negotiable CDs, public funds and other time deposits
32,264 1,076 3.33
20,557 974 4.74 12,195 483 3.97
Total domestic interest-bearing deposits
536,173 12,491 2.33
440,881 13,340 3.03 409,618 10,697 2.61
Foreign interest-bearing deposits:
Banks located in foreign countries
37,657 1,063 2.82
42,788 2,174 5.08 34,985 1,982 5.67
Governments and official institutions
13,004 311 2.39
16,523 812 4.91 12,674 586 4.63
Time, savings and other
51,363 1,385 2.70
43,443 1,767 4.07 38,544 1,215 3.15
Total foreign interest-bearing deposits
102,024 2,759 2.70
102,754 4,753 4.63 86,203 3,783 4.39
Total interest-bearing deposits
638,197 15,250 2.39
543,635 18,093 3.33 495,821 14,480 2.92
Federal funds purchased, securities sold under agreements to
repurchase and other short-term borrowings
455,710 12,362 2.71
424,814 21,967 5.17 411,132 19,837 4.83
Trading account liabilities
75,270 2,774 3.69
82,721 3,444 4.16 64,689 2,640 4.08
Long-term debt
231,235 9,938 4.30
169,855 9,359 5.51 130,124 7,034 5.41
Total interest-bearing liabilities (7)
1,400,412 40,324 2.88
1,221,025 52,863 4.33 1,101,766 43,991 3.99
Noninterest-bearing sources:
Noninterest-bearing deposits
192,947
173,547 177,174
Other liabilities
85,789
70,839 57,278
Shareholders’ equity
164,831
136,662 130,463
Total liabilities and shareholders’ equity
$1,843,979
$1,602,073 $1,466,681
Net interest spread
2.68%
2.08% 2.30%
Impact of noninterest-bearing sources
0.30
0.52 0.52
Net interest income/yield on earning assets
$46,554 2.98%
$36,190 2.60% $35,818 2.82%
(1) Interest income (FTE basis) in 2006 does not include the cumulative tax charge resulting from a change in tax legislation relating to extraterritorial tax income and foreign sales corporation regimes. The FTE impact to
net interest income and net interest yield on earning assets of this retroactive tax adjustment was a reduction of $270 million and two bps in 2006. Management has excluded this one-time impact to provide a more
comparative basis of presentation for net interest income and net interest yield on earning assets on a FTE basis. The impact on any given future period is not expected to be material.
(2) Yields on AFS debt securities are calculated based on fair value rather than historical cost balances. The use of fair value does not have a material impact on net interest yield.
(3) Nonperforming loans are included in the respective average loan balances. Income on these nonperforming loans is recognized on a cash basis. We account for acquired impaired loans in accordance with SOP 03-3.
Loans accounted for in accordance with SOP 03-3 were written down to fair value upon acquisition and accrete interest income over the remaining life of the loan.
(4) Includes foreign consumer loans of $2.7 billion, $3.8 billion and $3.4 billion in 2008, 2007 and 2006, respectively.
(5) Includes consumer finance loans of $2.8 billion, $3.2 billion and $2.9 billion in 2008, 2007 and 2006, respectively; and other foreign consumer loans of $774 million, $1.1 billion and $4.4 billion in 2008, 2007 and
2006, respectively.
(6) Includes domestic commercial real estate loans of $62.1 billion, $42.1 billion and $36.2 billion in 2008, 2007 and 2006, respectively.
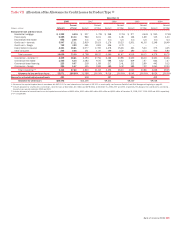
(7) Interest income includes the impact of interest rate risk management contracts, which decreased interest income on the underlying assets $260 million, $542 million and $372 million in 2008, 2007 and 2006,
respectively. Interest expense includes the impact of interest rate risk management contracts, which increased interest expense on the underlying liabilities $409 million, $813 million and $106 million in 2008, 2007
and 2006, respectively. For further information on interest rate contracts, see Interest Rate Risk Management for Nontrading Activities beginning on page 88.
n/a = not applicable
Bank of America 2008
99