Bank of America 2008 Annual Report Download - page 49
Download and view the complete annual report
Please find page 49 of the 2008 Bank of America annual report below. You can navigate through the pages in the report by either clicking on the pages listed below, or by using the keyword search tool below to find specific information within the annual report.-
 1
1 -
2
-
3
-
4
-
5
-
6
-
7
-
8
-
9
-
10
-
11
-
12
-
13
-
14
-
15
-
16
-
17
-
18
-
19
-
20
-
21
-
22
-
23
-
24
-
25
-
26
-
27
-
28
-
29
-
30
-
31
-
32
-
33
-
34
-
35
-
36
-
37
-
38
-
 39
39 -
 40
40 -
 41
41 -
 42
42 -
 43
43 -
 44
44 -
 45
45 -
 46
46 -
 47
47 -
 48
48 -
 49
49 -
 50
50 -
 51
51 -
 52
52 -
 53
53 -
 54
54 -
 55
55 -
 56
56 -
 57
57 -
 58
58 -
 59
59 -
60
-
61
-
62
-
63
-
64
-
65
-
66
-
67
-
68
-
69
-
70
-
71
-
72
-
73
-
74
-
75
-
76
-
77
-
78
-
79
-
80
-
81
-
82
-
83
-
84
-
85
-
86
-
87
-
88
-
89
-
90
-
91
-
92
-
93
-
94
-
95
-
96
-
97
-
98
-
99
-
100
-
101
-
102
-
103
-
104
-
105
-
106
-
107
-
108
-
109
-
110
-
111
-
112
-
113
-
114
-
115
-
116
-
117
-
118
-
119
-
120
-
121
-
122
-
123
-
124
-
125
-
126
-
127
-
128
-
129
-
130
-
131
-
132
-
133
-
134
-
135
-
136
-
137
-
138
-
139
-
140
-
141
-
142
-
143
-
144
-
145
-
146
-
147
-
148
-
149
-
150
-
151
-
152
-
153
-
154
-
155
-
156
-
157
-
158
-
159
-
160
-
161
-
162
-
163
-
164
-
165
-
166
-
167
-
168
-
169
-
170
-
171
-
172
-
173
-
174
-
175
-
176
-
177
-
178
-
179
-
180
-
181
-
182
-
183
-
184
-
185
-
186
-
187
-
188
-
189
-
190
-
191
-
192
-
193
-
194
-
195
 |
 |
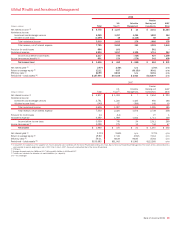
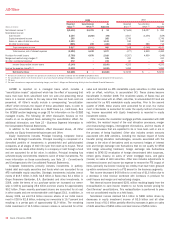
2007 primarily due to higher credit costs in our home equity and resi-
dential mortgage portfolios reflective of deterioration in the housing
markets and the impacts of a slowing economy. The absence of a prior
year reserve reduction of $54 million also contributed to the increase in
provision. Noninterest expense increased $228 million, or 14 percent
due primarily to the acquisitions of U.S. Trust Corporation and LaSalle.
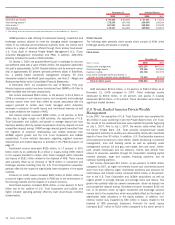
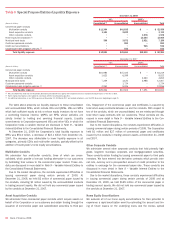
Columbia Management
Columbia is an asset management business serving the needs of both
institutional clients and individual customers. Columbia provides asset
management products and services, including mutual funds and separate
accounts. Columbia mutual fund offerings provide a broad array of
investment strategies and products including equity, fixed income
(taxable and nontaxable) and money market (taxable and nontaxable)
funds. Columbia distributes its products and services to institutional cli-
ents and individuals directly through U.S. Trust, PB&I, GCIB and non-
proprietary channels including other brokerage firms.
In December 2007, we completed the sale of Marsico. Prior year
Marsico business results have been transferred from Columbia to All
Other to better facilitate year-over-year comparisons.
Net income decreased $480 million to a loss of $459 million due to
$1.1 billion in losses related to support provided to certain cash funds as
discussed below, compared to losses of $382 million in 2007. These
items were partially offset by an increase of $61 million in investment
and brokerage services income. The increase in investment and broker-
age services income was driven by the U.S. Trust Corporation acquisition
partially offset by the impact of significantly lower valuations in the equity
markets. In addition, noninterest expense increased $78 million driven by
the U.S. Trust Corporation acquisition.
Cash Funds Support
Beginning in the second half of 2007, we provided support to certain
cash funds managed within Columbia. The funds for which we provided
support typically invested in high quality, short-term securities with a port-
folio weighted average maturity of 90 days or less, including securities
issued by SIVs and senior debt holdings of financial service companies.
Due to market disruptions, certain investments in SIVs and the senior
debt securities were downgraded by the rating agencies and experienced
a decline in fair value. We entered into capital commitments under which
the Corporation provided cash to these funds in the event the net asset
value per unit of a fund declined below certain thresholds. The capital
commitments expire no later than the third quarter of 2010. At
December 31, 2008 and 2007 we had gross (i.e., funded and unfunded)
capital commitments to the funds of $1.0 billion and $565 million. During
2008 and 2007, we incurred losses of $695 million and $382 million
related to these capital commitments. At December 31, 2008 and 2007,
the remaining loss exposure on capital commitments was $300 million
and $183 million.
Additionally, during 2008 we purchased $1.7 billion of investments
and recorded losses of $366 million related to these securities and $52
million of other-than-temporary impairment losses recorded subsequent to
purchase. During 2007, we purchased $585 million of certain invest-
ments from the funds and subsequently recorded other-than-temporary
impairment losses in All Other of $394 million. At December 31, 2008
and 2007, we held AFS debt securities with a fair value of $698 million
and $163 million of which $279 million and $163 million were classified
as nonperforming AFS securities. At December 31, 2008, $272 million of
unrealized losses on these investments were recorded in accumulated
OCI. The decline in value of these securities was driven by the lack of
market liquidity and the overall deterioration of the financial markets.
These unrealized losses are recorded in accumulated OCI as we expect to
recover the full principal amount of such investments. No such losses
were recorded in accumulated OCI at December 31, 2007. For additional
information on the valuation of our AFS securities, see Note 5 – Secu-
rities to the Consolidated Financial Statements.
We may from time to time, but are under no obligation to, provide
additional support to funds managed within Columbia. Future support, if
any, may take the form of additional capital commitments to the funds or
the purchase of assets from the funds.
We do not consolidate the cash funds managed within Columbia
because the subordinated support provided by the Corporation will not
absorb a majority of the variability created by the assets of the funds. In
reaching this conclusion, we considered both interest rate and credit risk.
The cash funds had total AUM of $185.9 billion and $189.5 billion at
December 31, 2008 and 2007.
During 2008, federal government agencies initiated several actions in
response to the current financial crisis and economic slowdown to pro-
vide liquidity in these markets. As of December 31, 2008 several money
market funds managed within Columbia participate in certain programs,
including the U.S. Treasury’s Temporary Guarantee Program for Money
Market Funds and the AMLF. For more information on these programs,
see Regulatory Initiatives on page 20.
Premier Banking and Investments
PB&I includes Banc of America Investments, our full-service retail broker-
age business and our Premier Banking channel. PB&I brings personalized
banking and investment expertise through priority service with client-
dedicated teams. PB&I provides a high-touch client experience through a
network of approximately 5,500 client facing associates to our affluent
customers with a personal wealth profile of at least $100,000 of invest-
able assets.
PB&I includes the impact of migrating qualifying affluent customers,
including their related deposit balances, from GCSBB to our PB&I model.
After migration, the associated net interest income, service charges and
noninterest expense is recorded in PB&I. The change reported in the
financial results of PB&I includes both the impact of migration, as well as
the impact of incremental organic growth from providing a broader array of
financial products and services to PB&I customers. For 2008 and 2007,
a total of $20.5 billion and $11.4 billion of deposits were migrated from
GCSBB to PB&I. The increase was driven by the initial migration of legacy
LaSalle accounts and the migration of qualified clients into PB&I as part
of our growth initiatives for our mass affluent and retirement customers.
Net income decreased $683 million, or 54 percent, to $584 million
compared to the same period in 2007 driven by an increase in provision
for credit losses, lower net interest income and $131 million in losses
related to the buyback of ARS. Net interest income declined $513 million,
or 19 percent, as spread compression, driven by deposit mix and com-
petitive deposit pricing, more than offset higher average deposit balan-
ces. Provision for credit losses increased $534 million primarily driven by
higher credit costs in the home equity portfolio reflective of deterioration
in the housing markets and the impacts of a slowing economy.
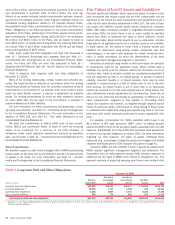
ALM/Other
ALM/Other primarily includes the results of ALM activities.
Net income increased $629 million to $831 million compared to
2007. These increases were driven by higher net interest income of $1.2
billion primarily due to the increased contribution from ALM activities,
which was due in part to investing the Corporation’s deposits at profitable
spreads. In addition, noninterest expense increased $116 million, or 84
percent, to $254 million compared to 2007 primarily driven by higher
expenses related to growth initiatives for our mass affluent and retire-
ment customers.
Bank of America 2008
47