Bank of America 2008 Annual Report Download - page 85
Download and view the complete annual report
Please find page 85 of the 2008 Bank of America annual report below. You can navigate through the pages in the report by either clicking on the pages listed below, or by using the keyword search tool below to find specific information within the annual report.-
 1
1 -
2
-
3
-
4
-
5
-
6
-
7
-
8
-
9
-
10
-
11
-
12
-
13
-
14
-
15
-
16
-
17
-
18
-
19
-
20
-
21
-
22
-
23
-
24
-
25
-
26
-
27
-
28
-
29
-
30
-
31
-
32
-
33
-
34
-
35
-
36
-
37
-
38
-
39
-
40
-
41
-
42
-
43
-
44
-
45
-
46
-
47
-
48
-
49
-
50
-
51
-
52
-
53
-
54
-
55
-
56
-
57
-
58
-
59
-
60
-
61
-
62
-
63
-
64
-
65
-
66
-
67
-
68
-
69
-
70
-
71
-
72
-
73
-
74
-
 75
75 -
 76
76 -
 77
77 -
 78
78 -
 79
79 -
 80
80 -
 81
81 -
 82
82 -
 83
83 -
 84
84 -
 85
85 -
 86
86 -
 87
87 -
 88
88 -
 89
89 -
 90
90 -
 91
91 -
 92
92 -
 93
93 -
 94
94 -
 95
95 -
96
-
97
-
98
-
99
-
100
-
101
-
102
-
103
-
104
-
105
-
106
-
107
-
108
-
109
-
110
-
111
-
112
-
113
-
114
-
115
-
116
-
117
-
118
-
119
-
120
-
121
-
122
-
123
-
124
-
125
-
126
-
127
-
128
-
129
-
130
-
131
-
132
-
133
-
134
-
135
-
136
-
137
-
138
-
139
-
140
-
141
-
142
-
143
-
144
-
145
-
146
-
147
-
148
-
149
-
150
-
151
-
152
-
153
-
154
-
155
-
156
-
157
-
158
-
159
-
160
-
161
-
162
-
163
-
164
-
165
-
166
-
167
-
168
-
169
-
170
-
171
-
172
-
173
-
174
-
175
-
176
-
177
-
178
-
179
-
180
-
181
-
182
-
183
-
184
-
185
-
186
-
187
-
188
-
189
-
190
-
191
-
192
-
193
-
194
-
195
 |
 |

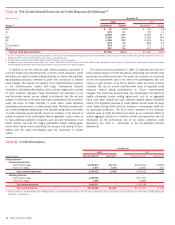
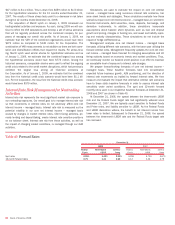
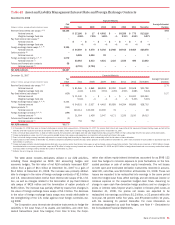
Table 37 presents a rollforward of the allowance for credit losses for 2008 and 2007.
Table 37 Allowance for Credit Losses
(Dollars in millions) 2008 2007
Allowance for loan and lease losses, January 1
$ 11,588
$ 9,016
Adjustment due to the adoption of SFAS 159
–
(32)
Loans and leases charged off
Residential mortgage
(964)
(78)
Home equity
(3,597)
(286)
Discontinued real estate
(19)
n/a
Credit card – domestic
(4,469)
(3,410)
Credit card – foreign
(639)
(453)
Direct/Indirect consumer
(3,777)
(1,885)
Other consumer
(461)
(346)
Total consumer charge-offs
(13,926)
(6,458)
Commercial – domestic
(1)
(2,567)
(1,135)
Commercial real estate
(895)
(54)
Commercial lease financing
(79)
(55)
Commercial – foreign
(199)
(28)
Total commercial charge-offs
(3,740)
(1,272)
Total loans and leases charged off
(17,666)
(7,730)
Recoveries of loans and leases previously charged off
Residential mortgage
39
22
Home equity
101
12
Discontinued real estate
3
n/a
Credit card – domestic
308
347
Credit card – foreign
88
74
Direct/Indirect consumer
663
512
Other consumer
62
68
Total consumer recoveries
1,264
1,035
Commercial – domestic
(2)
118
128
Commercial real estate
8
7
Commercial lease financing
19
53
Commercial – foreign
26
27
Total commercial recoveries
171
215
Total recoveries of loans and leases previously charged off
1,435
1,250
Net charge-offs
(16,231)
(6,480)
Provision for loan and lease losses
26,922
8,357
Other
(3)
792
727
Allowance for loan and lease losses, December 31
23,071
11,588
Reserve for unfunded lending commitments, January 1
518
397
Adjustment due to the adoption of SFAS 159
–
(28)
Provision for unfunded lending commitments
(97)
28
Other
(4)
–
121
Reserve for unfunded lending commitments, December 31
421
518
Allowance for credit losses, December 31
$ 23,492
$ 12,106
Loans and leases outstanding at December 31
(5)
$926,033
$871,754
Allowance for loan and lease losses as a percentage of total loans and leases outstanding at December 31
(5, 6)
2.49%
1.33%
Consumer allowance for loan and lease losses as a percentage of total consumer loans and leases outstanding at December 31
(6)
2.83
1.23
Commercial allowance for loan and lease losses as a percentage of total commercial loans and leases outstanding at December 31
(5)
1.90
1.51
Average loans and leases outstanding at December 31
(5, 6)
$905,944
$773,142
Net charge-offs as a percentage of average loans and leases outstanding at December 31
(5, 6)
1.79%
0.84%
Allowance for loan and lease losses as a percentage of total nonperforming loans and leases at December 31
(5, 6)
141
207
Ratio of the allowance for loan and lease losses at December 31 to net charge-offs
(6)
1.42
1.79
(1) Includes small business commercial – domestic charge-offs of $2.0 billion and $931 million in 2008 and 2007.
(2) Includes small business commercial – domestic recoveries of $39 million and $51 million in 2008 and 2007.
(3) The 2008 amount includes the $1.2 billion addition of the Countrywide allowance for loan losses as of July 1, 2008. The 2007 amount includes the $725 million and $25 million additions of the LaSalle and U.S. Trust
Corporation allowance for loan losses as of October 1, 2007 and July 1, 2007.
(4) The 2007 amount includes the $124 million addition of the LaSalle reserve for unfunded lending commitments as of October 1, 2007.
(5) Outstanding loan and lease balances and ratios do not include loans measured at fair value in accordance with SFAS 159 at and for the year ended December 31, 2008 and 2007. Loans measured at fair value were
$5.4 billion and $4.6 billion at December 31, 2008 and 2007. Average loans measured at fair value were $4.9 billion and $3.0 billion for 2008 and 2007.
(6) We account for acquired impaired loans in accordance with SOP 03-3. For more information on the impact of SOP 03-3 on asset quality, see Consumer Portfolio Credit Risk Management beginning on page 62.
n/a = not applicable
Bank of America 2008
83