Bank of America 2008 Annual Report Download - page 32
Download and view the complete annual report
Please find page 32 of the 2008 Bank of America annual report below. You can navigate through the pages in the report by either clicking on the pages listed below, or by using the keyword search tool below to find specific information within the annual report.-
 1
1 -
2
-
3
-
4
-
5
-
6
-
7
-
8
-
9
-
10
-
11
-
12
-
13
-
14
-
15
-
16
-
17
-
18
-
19
-
20
-
21
-
 22
22 -
 23
23 -
 24
24 -
 25
25 -
 26
26 -
 27
27 -
 28
28 -
 29
29 -
 30
30 -
 31
31 -
 32
32 -
 33
33 -
 34
34 -
 35
35 -
 36
36 -
 37
37 -
 38
38 -
 39
39 -
 40
40 -
 41
41 -
 42
42 -
43
-
44
-
45
-
46
-
47
-
48
-
49
-
50
-
51
-
52
-
53
-
54
-
55
-
56
-
57
-
58
-
59
-
60
-
61
-
62
-
63
-
64
-
65
-
66
-
67
-
68
-
69
-
70
-
71
-
72
-
73
-
74
-
75
-
76
-
77
-
78
-
79
-
80
-
81
-
82
-
83
-
84
-
85
-
86
-
87
-
88
-
89
-
90
-
91
-
92
-
93
-
94
-
95
-
96
-
97
-
98
-
99
-
100
-
101
-
102
-
103
-
104
-
105
-
106
-
107
-
108
-
109
-
110
-
111
-
112
-
113
-
114
-
115
-
116
-
117
-
118
-
119
-
120
-
121
-
122
-
123
-
124
-
125
-
126
-
127
-
128
-
129
-
130
-
131
-
132
-
133
-
134
-
135
-
136
-
137
-
138
-
139
-
140
-
141
-
142
-
143
-
144
-
145
-
146
-
147
-
148
-
149
-
150
-
151
-
152
-
153
-
154
-
155
-
156
-
157
-
158
-
159
-
160
-
161
-
162
-
163
-
164
-
165
-
166
-
167
-
168
-
169
-
170
-
171
-
172
-
173
-
174
-
175
-
176
-
177
-
178
-
179
-
180
-
181
-
182
-
183
-
184
-
185
-
186
-
187
-
188
-
189
-
190
-
191
-
192
-
193
-
194
-
195
 |
 |

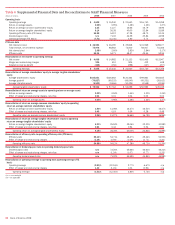
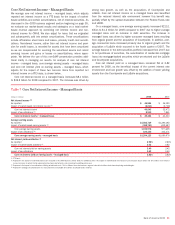
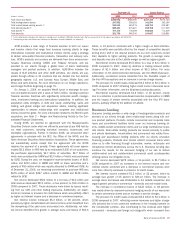
Table 6 Supplemental Financial Data and Reconciliations to GAAP Financial Measures
(Dollars in millions) 2008 2007 2006 2005 2004
Operating basis
Operating earnings
$ 4,638
$ 15,240 $ 21,640 $ 16,740 $ 14,358
Return on average assets
0.25%
0.95% 1.48% 1.32% 1.37%
Return on average common shareholders’ equity
2.25
11.27 16.66 16.79 16.96
Return on average tangible shareholders’ equity
6.14
26.38 40.00 32.84 31.89
Operating efficiency ratio (FTE basis)
54.88
54.12 47.28 48.73 51.35
Dividend payout ratio
n/m
71.02 44.59 45.84 44.98
Operating leverage (FTE basis)
(1.51)
(13.40) 3.80 5.74 n/a
FTE basis data
Net interest income
$ 46,554
$ 36,190 $ 35,818 $ 31,569 $ 28,677
Total revenue, net of interest expense
73,976
68,582 74,000 58,007 51,406
Net interest yield
2.98%
2.60% 2.82% 2.84% 3.17%
Efficiency ratio
56.14
54.71 48.37 49.44 52.55
Reconciliation of net income to operating earnings
Net income
$ 4,008
$ 14,982 $ 21,133 $ 16,465 $ 13,947
Merger and restructuring charges
935
410 805 412 618
Related income tax benefit
(305)
(152) (298) (137) (207)
Operating earnings
$ 4,638
$ 15,240 $ 21,640 $ 16,740 $ 14,358
Reconciliation of average shareholders’ equity to average tangible shareholders’
equity
Average shareholders’ equity
$164,831
$136,662 $130,463 $ 99,861 $ 84,815
Average goodwill
(79,827)
(69,333) (66,040) (45,331) (36,612)
Average intangible assets
(9,502)
(9,566) (10,324) (3,548) (3,184)
Average tangible shareholders’ equity
$ 75,502
$ 57,763 $ 54,099 $ 50,982 $ 45,019
Reconciliation of return on average assets to operating return on average assets
Return on average assets
0.22%
0.94% 1.44% 1.30% 1.34%
Effect of merger and restructuring charges, net-of-tax
0.03
0.01 0.04 0.02 0.03
Operating return on average assets
0.25%
0.95% 1.48% 1.32% 1.37%
Reconciliation of return on average common shareholders’ equity to operating
return on average common shareholders’ equity
Return on average common shareholders’ equity
1.80%
11.08% 16.27% 16.51% 16.47%
Effect of merger and restructuring charges, net-of-tax
0.45
0.19 0.39 0.28 0.49
Operating return on average common shareholders’ equity
2.25%
11.27% 16.66% 16.79% 16.96%
Reconciliation of return on average tangible shareholders’ equity to operating
return on average tangible shareholders’ equity
Return on average tangible shareholders’ equity
5.31%
25.94% 39.06% 32.30% 30.98%
Effect of merger and restructuring charges, net-of-tax
0.83
0.44 0.94 0.54 0.91
Operating return on average tangible shareholders’ equity
6.14%
26.38% 40.00% 32.84% 31.89%
Reconciliation of efficiency ratio to operating efficiency ratio (FTE basis)
Efficiency ratio
56.14%
54.71% 48.37% 49.44% 52.55%
Effect of merger and restructuring charges
(1.26)
(0.59) (1.09) (0.71) (1.20)
Operating efficiency ratio
54.88%
54.12% 47.28% 48.73% 51.35%
Reconciliation of dividend payout ratio to operating dividend payout ratio
Dividend payout ratio
n/m
72.26% 45.66% 46.61% 46.31%
Effect of merger and restructuring charges, net-of-tax
n/m
(1.24) (1.07) (0.77) (1.33)
Operating dividend payout ratio
n/m
71.02% 44.59% 45.84% 44.98%
Reconciliation of operating leverage to operating basis operating leverage (FTE
basis)
Operating leverage
(2.81)%
(12.16)% 2.77% 6.67% n/a
Effect of merger and restructuring charges
1.30
(1.24) 1.03 (0.93) n/a
Operating leverage
(1.51)%
(13.40)% 3.80% 5.74% n/a
n/m = not meaningful
n/a = not applicable
30
Bank of America 2008