Bank of America 2008 Annual Report Download - page 135
Download and view the complete annual report
Please find page 135 of the 2008 Bank of America annual report below. You can navigate through the pages in the report by either clicking on the pages listed below, or by using the keyword search tool below to find specific information within the annual report.-
 1
1 -
2
-
3
-
4
-
5
-
6
-
7
-
8
-
9
-
10
-
11
-
12
-
13
-
14
-
15
-
16
-
17
-
18
-
19
-
20
-
21
-
22
-
23
-
24
-
25
-
26
-
27
-
28
-
29
-
30
-
31
-
32
-
33
-
34
-
35
-
36
-
37
-
38
-
39
-
40
-
41
-
42
-
43
-
44
-
45
-
46
-
47
-
48
-
49
-
50
-
51
-
52
-
53
-
54
-
55
-
56
-
57
-
58
-
59
-
60
-
61
-
62
-
63
-
64
-
65
-
66
-
67
-
68
-
69
-
70
-
71
-
72
-
73
-
74
-
75
-
76
-
77
-
78
-
79
-
80
-
81
-
82
-
83
-
84
-
85
-
86
-
87
-
88
-
89
-
90
-
91
-
92
-
93
-
94
-
95
-
96
-
97
-
98
-
99
-
100
-
101
-
102
-
103
-
104
-
105
-
106
-
107
-
108
-
109
-
110
-
111
-
112
-
113
-
114
-
115
-
116
-
117
-
118
-
119
-
120
-
121
-
122
-
123
-
124
-
 125
125 -
 126
126 -
 127
127 -
 128
128 -
 129
129 -
 130
130 -
 131
131 -
 132
132 -
 133
133 -
 134
134 -
 135
135 -
 136
136 -
 137
137 -
 138
138 -
 139
139 -
 140
140 -
 141
141 -
 142
142 -
 143
143 -
 144
144 -
 145
145 -
146
-
147
-
148
-
149
-
150
-
151
-
152
-
153
-
154
-
155
-
156
-
157
-
158
-
159
-
160
-
161
-
162
-
163
-
164
-
165
-
166
-
167
-
168
-
169
-
170
-
171
-
172
-
173
-
174
-
175
-
176
-
177
-
178
-
179
-
180
-
181
-
182
-
183
-
184
-
185
-
186
-
187
-
188
-
189
-
190
-
191
-
192
-
193
-
194
-
195
 |
 |

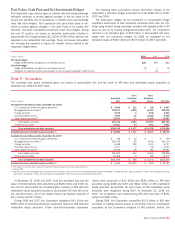
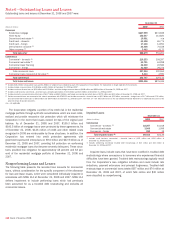
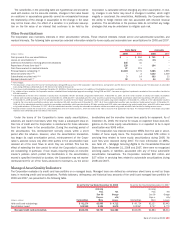
Note 3 – Trading Account Assets and Liabilities
The following table presents the fair values of the components of trading account assets and liabilities at December 31, 2008 and 2007.
December 31
(Dollars in millions) 2008 2007
Trading account assets
U.S. government and agency securities
(1)
$ 84,660
$ 48,240
Corporate securities, trading loans and other
34,056
55,360
Equity securities
20,258
22,910
Foreign sovereign debt
13,614
17,161
Mortgage trading loans and asset-backed securities
6,934
18,393
Total trading account assets
$159,522
$162,064
Trading account liabilities
U.S. government and agency securities
$ 32,850
$ 35,375
Equity securities
12,128
25,926
Foreign sovereign debt
7,252
9,292
Corporate securities and other
5,057
6,749
Total trading account liabilities
$ 57,287
$ 77,342
(1) Includes $52.6 billion and $21.5 billion at December 31, 2008 and 2007 of government-sponsored enterprise obligations.
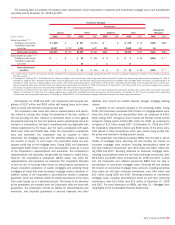
Note 4 – Derivatives
The Corporation designates derivatives as trading derivatives, economic
hedges, or as derivatives used for SFAS 133 accounting purposes. For
additional information on the Corporation’s derivatives and hedging activ-
ities, see Note 1 – Summary of Significant Accounting Principles to the
Consolidated Financial Statements.
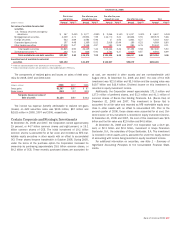
The following table presents the contract/notional amounts and credit
risk amounts at December 31, 2008 and 2007 of all the Corporation’s
derivative positions.
The credit risk amounts take into consideration the effects of legally
enforceable master netting agreements, and on an aggregate basis have
been reduced by the cash collateral applied against derivative assets. At
December 31, 2008 and 2007, the cash collateral applied against
derivative assets was $34.8 billion and $12.8 billion. In addition, at
December 31, 2008 and 2007, the cash collateral applied against
derivative liabilities was $30.3 billion and $10.0 billion. The average fair
value of derivative assets, less cash collateral, for 2008 and 2007 was
$48.1 billion and $29.7 billion. The average fair value of derivative
liabilities, less cash collateral, for 2008 and 2007 was $27.0 billion and
$20.6 billion. The Corporation held $48.8 billion of collateral on
derivative positions, of which $42.5 billion could be applied against credit
risk at December 31, 2008.
December 31, 2008 December 31, 2007
(Dollars in millions)
Contract/
Notional
(1)
Credit
Risk
Contract/
Notional
(1)
Credit
Risk
Interest rate contracts
Swaps
$26,577,385 $48,225
$22,472,949 $15,368
Futures and forwards
4,432,102 1,008
2,596,146 10
Written options
1,731,055 –
1,402,626 –
Purchased options
1,656,641 5,188
1,479,985 2,508
Foreign exchange contracts
Swaps
438,932 6,040
505,878 7,350
Spot, futures and forwards
1,376,483 10,888
1,600,683 4,124
Written options
199,846 –
341,148 –
Purchased options
175,678 2,002
339,101 1,033
Equity contracts
Swaps
34,685 1,338
56,300 2,026
Futures and forwards
14,145 198
12,174 10
Written options
214,125 –
166,736 –
Purchased options
217,461 7,284
195,240 6,337
Commodity contracts
Swaps
2,110 1,000
13,627 770
Futures and forwards
9,633 222
14,391 12
Written options
17,574 –
14,206 –
Purchased options
15,570 249
13,093 372
Credit derivatives
Purchased protection:
Credit default swaps
1,025,876 11,772
1,490,641 6,822
Total return swaps
6,575 1,678
13,551 671
Written protection:
Credit default swaps
1,000,034 –
1,517,305 –
Total return swaps
6,203 –
24,884 –
Credit risk before cash collateral
97,092
47,413
Less: Cash collateral applied
34,840
12,751
Total derivative assets
$62,252
$34,662
(1) Represents the total contract/notional amount of the derivatives outstanding and includes both written and purchased protection.
Bank of America 2008
133