Bank of America 2008 Annual Report Download - page 55
Download and view the complete annual report
Please find page 55 of the 2008 Bank of America annual report below. You can navigate through the pages in the report by either clicking on the pages listed below, or by using the keyword search tool below to find specific information within the annual report.-
 1
1 -
2
-
3
-
4
-
5
-
6
-
7
-
8
-
9
-
10
-
11
-
12
-
13
-
14
-
15
-
16
-
17
-
18
-
19
-
20
-
21
-
22
-
23
-
24
-
25
-
26
-
27
-
28
-
29
-
30
-
31
-
32
-
33
-
34
-
35
-
36
-
37
-
38
-
39
-
40
-
41
-
42
-
43
-
44
-
 45
45 -
 46
46 -
 47
47 -
 48
48 -
 49
49 -
 50
50 -
 51
51 -
 52
52 -
 53
53 -
 54
54 -
 55
55 -
 56
56 -
 57
57 -
 58
58 -
 59
59 -
 60
60 -
 61
61 -
 62
62 -
 63
63 -
 64
64 -
 65
65 -
66
-
67
-
68
-
69
-
70
-
71
-
72
-
73
-
74
-
75
-
76
-
77
-
78
-
79
-
80
-
81
-
82
-
83
-
84
-
85
-
86
-
87
-
88
-
89
-
90
-
91
-
92
-
93
-
94
-
95
-
96
-
97
-
98
-
99
-
100
-
101
-
102
-
103
-
104
-
105
-
106
-
107
-
108
-
109
-
110
-
111
-
112
-
113
-
114
-
115
-
116
-
117
-
118
-
119
-
120
-
121
-
122
-
123
-
124
-
125
-
126
-
127
-
128
-
129
-
130
-
131
-
132
-
133
-
134
-
135
-
136
-
137
-
138
-
139
-
140
-
141
-
142
-
143
-
144
-
145
-
146
-
147
-
148
-
149
-
150
-
151
-
152
-
153
-
154
-
155
-
156
-
157
-
158
-
159
-
160
-
161
-
162
-
163
-
164
-
165
-
166
-
167
-
168
-
169
-
170
-
171
-
172
-
173
-
174
-
175
-
176
-
177
-
178
-
179
-
180
-
181
-
182
-
183
-
184
-
185
-
186
-
187
-
188
-
189
-
190
-
191
-
192
-
193
-
194
-
195
 |
 |

est rate scenarios and discounting these cash flows using risk-adjusted
discount rates. The key economic assumptions used in valuations of
MSRs include weighted average lives of the MSRs and the OAS levels.
For more information on Level 3 MSRs and their sensitivity to prepayment
rates and OAS levels, see Note 21 – Mortgage Servicing Rights to the
Consolidated Financial Statements.
For additional information on our Level 1, 2 and 3 fair value measure-
ments, including the valuation techniques utilized to determine their fair
values, see Note 1 – Summary of Significant Accounting Principles and
Note 19 – Fair Value Disclosures to the Consolidated Financial State-
ments and Complex Accounting Estimates on page 93.
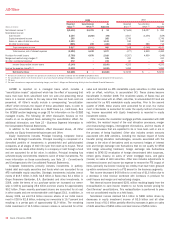
Valuation-related issues confronted by credit market participants,
including the Corporation, in the current market include uncertainty result-
ing from a significant decline in market activity for certain credit products;
significant increase in dependence on model-related assumptions, and/or
unobservable model inputs; doubts about the quality of the market
information used as inputs, often because it is not clear whether
observable transactions are distressed sales; and significant downgrades
of structured products by ratings agencies. For example, valuations of
certain CDO securities and related written put options declined sig-
nificantly in response to market concerns. Additionally, liquidity issues in
the ARS sector impacted the value of such securities. It is possible that
the economic value of these securities could be different as the cash
flows from the underlying assets may ultimately be higher or lower than
the assumptions used in current valuation models. With the exception of
the changes discussed below, there have been no significant changes to
the valuation methodologies used to value Level 3 assets and liabilities
during the period.
The table below presents a reconciliation for all Level 3 assets and
liabilities measured at fair value on a recurring basis during 2008, includ-
ing realized and unrealized gains (losses) included in earnings and OCI.
Level 3 assets, before the impact of counterparty netting related to our
derivative positions, were $59.4 billion as of December 31, 2008 and
represented approximately 10 percent of assets measured at fair value
(or three percent of total assets). Level 3 liabilities, before the impact of
counterparty netting related to our derivative positions, were $8.0 billion
as of December 31, 2008 and represented approximately nine percent of
the liabilities measured at fair value (or less than one percent of total
liabilities). See Note 19 – Fair Value Disclosures to the Consolidated
Financial Statements for a table that presents the fair value of Level 1, 2
and 3 assets and liabilities at December 31, 2008.
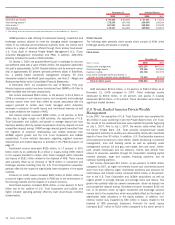
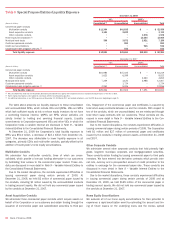
Countrywide Acquisition
The Countrywide acquisition on July 1, 2008 added consumer MSRs of
$17.2 billion, trading account assets of $1.4 billion, LHFS of $1.4 billion,
accrued expenses and other liabilities of $1.2 billion related to certain
secured financings and AFS debt securities of $528 million to our Level 3
assets and liabilities. Activity subsequent to July 1, 2008 has been
included in the reconciling items in the table below.
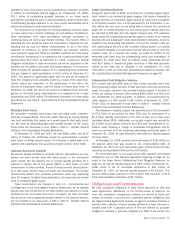
Included in Earnings and Other Comprehensive Income
During 2008, we recognized losses of $12.1 billion on Level 3 assets
and liabilities which were primarily related to losses on consumer MSRs,
trading account assets and AFS debt securities partially offset by gains
on net derivatives. The losses on consumer MSRs were due to declines
in mortgage rates which resulted in a significant increase in expected
prepayments causing large decreases in the value of our consumer
MSRs. These consumer MSR losses were more than offset by economic
hedge gains of which approximately $750 million were classified as Level
3. The losses in our trading account assets were due to widening credit
spreads on our trading account positions and losses related to CDOs and
ARS. The losses on AFS debt securities were primarily driven by other-
than-temporary impairment on CDO-related exposures and losses on cer-
tain investments we purchased from our GWIM cash funds. The gains in
net derivatives were driven by positive valuation adjustments on our
IRLCs, MSR hedge gains, and gains recognized on hedges of our Level 3
trading account assets. We also recorded unrealized losses of $1.7 bil-
lion (pre-tax) through OCI during 2008, due to widening credit spreads on
mortgage-backed securities collateralized by first liens on residential real
estate, as well as temporary impairments recognized on commercial
paper and term notes. These decreases were partially offset by the
unrealized gains on privately placed mortgage-backed securities that were
transferred into Level 3 during 2008.
Level 3 financial instruments, such as our consumer MSRs may be
economically hedged with derivatives not classified as Level 3; therefore,
gains or losses associated with Level 3 financial instruments may be
offset by gains or losses associated with financial instruments classified
in other levels of the fair value hierarchy. The net losses recorded in earn-
ings and OCI did not have a significant impact on our liquidity or capital
resources.
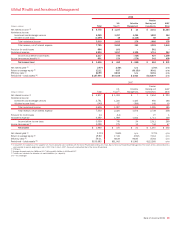
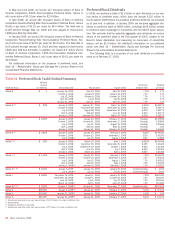
Table 10 Level 3 – Fair Value Measurements
Year Ended December 31, 2008
(Dollars in millions)
Net
Derivatives
(1)
Trading
Account
Assets
Available-
for-Sale
Debt
Securities
Loans
and
Leases
(2)
Mortgage
Servicing
Rights
Loans
Held-for-
Sale
(2)
Other
Assets
(3)
Accrued
Expenses
and Other
Liabilities
(2)
Balance, January 1, 2008
$(1,203)
$ 4,027 $ 5,507 $4,590 $ 3,053 $ 1,334 $3,987 $ (660)
Countrywide acquisition
(185)
1,407 528 – 17,188 1,425 – (1,212)
Included in earnings
2,531
(3,222) (2,509) (780) (7,115) (1,047) 175 (169)
Included in OCI
–
– (1,688) – – – – –
Purchases, issuances, and settlements
1,380
(2,055) 2,754 1,603 (393) (542) (550) 101
Transfers into (out of) Level 3
(253)
7,161 14,110 – – 2,212 (40) –
Balance, December 31, 2008
$ 2,270
$ 7,318 $18,702 $5,413 $12,733 $ 3,382 $3,572 $(1,940)
(1) Net derivatives at December 31, 2008 included derivative assets of $8.3 billion and derivative liabilities of $6.0 billion. Net derivatives acquired in connection with Countrywide included derivative assets of $107
million and derivative liabilities of $292 million as of July 1, 2008.
(2) Amounts represent items which are accounted for at fair value in accordance with SFAS 159 including commercial loan commitments and certain secured financings recorded in accrued expenses and other liabilities.
(3) Other assets include equity investments held by Principal Investing and certain retained interests in securitization vehicles, including interest-only strips.
Bank of America 2008
53