Bank of America 2008 Annual Report Download - page 6
Download and view the complete annual report
Please find page 6 of the 2008 Bank of America annual report below. You can navigate through the pages in the report by either clicking on the pages listed below, or by using the keyword search tool below to find specific information within the annual report.-
 1
1 -
 2
2 -
 3
3 -
 4
4 -
 5
5 -
 6
6 -
 7
7 -
 8
8 -
 9
9 -
 10
10 -
 11
11 -
 12
12 -
 13
13 -
 14
14 -
 15
15 -
 16
16 -
 17
17 -
18
-
19
-
20
-
21
-
22
-
23
-
24
-
25
-
26
-
27
-
28
-
29
-
30
-
31
-
32
-
33
-
34
-
35
-
36
-
37
-
38
-
39
-
40
-
41
-
42
-
43
-
44
-
45
-
46
-
47
-
48
-
49
-
50
-
51
-
52
-
53
-
54
-
55
-
56
-
57
-
58
-
59
-
60
-
61
-
62
-
63
-
64
-
65
-
66
-
67
-
68
-
69
-
70
-
71
-
72
-
73
-
74
-
75
-
76
-
77
-
78
-
79
-
80
-
81
-
82
-
83
-
84
-
85
-
86
-
87
-
88
-
89
-
90
-
91
-
92
-
93
-
94
-
95
-
96
-
97
-
98
-
99
-
100
-
101
-
102
-
103
-
104
-
105
-
106
-
107
-
108
-
109
-
110
-
111
-
112
-
113
-
114
-
115
-
116
-
117
-
118
-
119
-
120
-
121
-
122
-
123
-
124
-
125
-
126
-
127
-
128
-
129
-
130
-
131
-
132
-
133
-
134
-
135
-
136
-
137
-
138
-
139
-
140
-
141
-
142
-
143
-
144
-
145
-
146
-
147
-
148
-
149
-
150
-
151
-
152
-
153
-
154
-
155
-
156
-
157
-
158
-
159
-
160
-
161
-
162
-
163
-
164
-
165
-
166
-
167
-
168
-
169
-
170
-
171
-
172
-
173
-
174
-
175
-
176
-
177
-
178
-
179
-
180
-
181
-
182
-
183
-
184
-
185
-
186
-
187
-
188
-
189
-
190
-
191
-
192
-
193
-
194
-
195
 |
 |

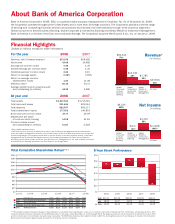
dividends and available to common
shareholders were $2.56 billion, or
$0.55 per diluted share, down from
$14.80 billion, or $3.30 per diluted
share, a year earlier. Revenue (on a
fully taxable-equivalent basis) rose 8
percent to $73.98 billion from $68.58
billion in 2007, from organic growth
and the addition of U.S. Trust, LaSalle
and Countrywide.
Return on average common share-
holders’ equity fell to 1.80 percent
from 11.08 percent. Our efficiency
ratio stayed well outside our target
range (under 50 percent), at 56.14
percent. Provision expense rose
$18.44 billion to $26.83 billion,
and nonperforming assets and net
charge-off ratios rose to 1.96 percent
and 1.79 percent, respectively.
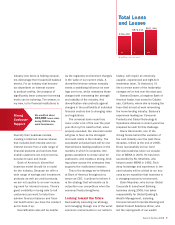
There is no question that the reces-
sionary environment is hurting results
in all our businesses. And yet, the
news is not bad across the board. The
bulk of our losses in 2008 were the
result of severe market and economic
impacts in three of our businesses in
particular: Mortgage, Home Equity &
Insurance Services (MHEIS); Capital
Markets & Advisory Services (CMAS);
and Columbia Management. All of our
other businesses were able to gener-
ate a profit despite the harsh eco-
nomic environment, and two actually
increased net income in 2008.
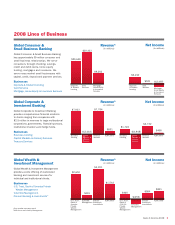
Within Global Consumer & Small
Business Banking (GCSBB), Depos-
its and Student Lending net income
increased 9 percent to $6.21 billion,
and Card Services, which has been bat-
tered by rising credit costs, still man-
aged to post net income for the year
of $521 million. In Global Corporate &
Investment Banking (GCIB), Business
Lending posted net income of $1.72
billion (down 14 percent on higher
credit costs), and Treasury Services net
income increased 28 percent to $2.73
billion. In Global Wealth & Investment
Management (GWIM), U.S. Trust earned
$460 million (down just 2 percent)
and Premier Banking and Investments
earned $584 million (a 54 percent
decrease due to higher credit costs).
The ability of our associates in
these businesses to generate sub-
stantial profits in our current economic
environment is a testament to their
skill and determination, and to the
advantages of our broad franchise. The
profitability of these businesses also
demonstrates why we value revenue
diversity so highly in our business model.
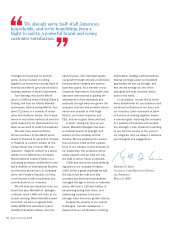
In times of severe financial stress,
what financial institutions need more
than anything is capital. Bank of
America has, for years, been among
the most well-capitalized banks in the
world. But the fourth quarter of 2008
tested even our ability to maintain a
deep well of financial resources.
In early October, to shore up capital
levels as credit losses accelerated,
we raised nearly $10 billion through
the sale of common stock and cut our
dividend on common stock in half.
Then, in mid-October, the U.S. Treasury
Department decided to use funds from
the Troubled Asset Relief Program
(TARP) to inject capital directly into the
nation’s banks through purchases of
preferred stock.
At the outset of this program, we
accepted an investment of $15 billion.
We also agreed at that time to accept
Merrill Lynch’s initial share of the TARP
funds, $10 billion, in early January.
After discussions with federal govern-
ment officials, the government agreed
to provide an additional $20 billion in
January to enable the closing of our
acquisition of Merrill Lynch.
All three preferred stock invest-
ments will yield a dividend to the U.S.
Treasury and have repayment terms for
the full amount of the investment. We
paid our first dividend to the U.S. Trea-
sury Department on all three tranches
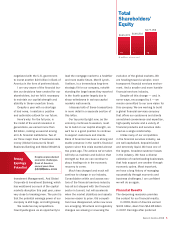
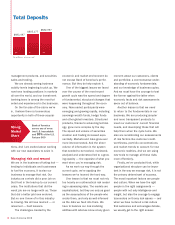
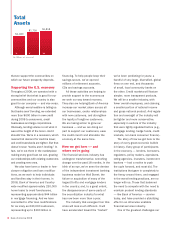
Bank of America
holds $883 billion
in total deposits,
up 9.7% in 2008
Strong
Deposit
Growth
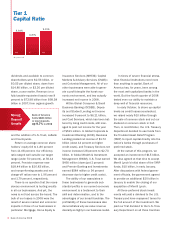
Tier 1
Capital Ratio
’07 ’08
8.64%
6.87%
9.15%
At year e nd
’06
4 Bank of America 2008