Bank of America 2008 Annual Report Download - page 45
Download and view the complete annual report
Please find page 45 of the 2008 Bank of America annual report below. You can navigate through the pages in the report by either clicking on the pages listed below, or by using the keyword search tool below to find specific information within the annual report.-
 1
1 -
2
-
3
-
4
-
5
-
6
-
7
-
8
-
9
-
10
-
11
-
12
-
13
-
14
-
15
-
16
-
17
-
18
-
19
-
20
-
21
-
22
-
23
-
24
-
25
-
26
-
27
-
28
-
29
-
30
-
31
-
32
-
33
-
34
-
 35
35 -
 36
36 -
 37
37 -
 38
38 -
 39
39 -
 40
40 -
 41
41 -
 42
42 -
 43
43 -
 44
44 -
 45
45 -
 46
46 -
 47
47 -
 48
48 -
 49
49 -
 50
50 -
 51
51 -
 52
52 -
 53
53 -
 54
54 -
 55
55 -
56
-
57
-
58
-
59
-
60
-
61
-
62
-
63
-
64
-
65
-
66
-
67
-
68
-
69
-
70
-
71
-
72
-
73
-
74
-
75
-
76
-
77
-
78
-
79
-
80
-
81
-
82
-
83
-
84
-
85
-
86
-
87
-
88
-
89
-
90
-
91
-
92
-
93
-
94
-
95
-
96
-
97
-
98
-
99
-
100
-
101
-
102
-
103
-
104
-
105
-
106
-
107
-
108
-
109
-
110
-
111
-
112
-
113
-
114
-
115
-
116
-
117
-
118
-
119
-
120
-
121
-
122
-
123
-
124
-
125
-
126
-
127
-
128
-
129
-
130
-
131
-
132
-
133
-
134
-
135
-
136
-
137
-
138
-
139
-
140
-
141
-
142
-
143
-
144
-
145
-
146
-
147
-
148
-
149
-
150
-
151
-
152
-
153
-
154
-
155
-
156
-
157
-
158
-
159
-
160
-
161
-
162
-
163
-
164
-
165
-
166
-
167
-
168
-
169
-
170
-
171
-
172
-
173
-
174
-
175
-
176
-
177
-
178
-
179
-
180
-
181
-
182
-
183
-
184
-
185
-
186
-
187
-
188
-
189
-
190
-
191
-
192
-
193
-
194
-
195
 |
 |

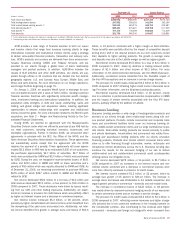
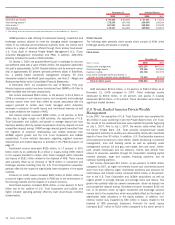
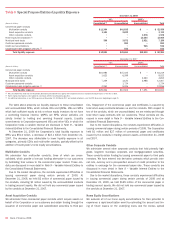
At December 31, 2008, we held $2.5 billion of purchased insurance
on our subprime super senior CDO exposure of which 71 percent was
provided by monolines in the form of CDS, total-return-swaps (TRS) or
financial guarantees. In the case of default, we look to the underlying
securities and then to recovery on purchased insurance. At December 31,
2008, these contracts were valued at $1.9 billion by referencing the fair
value of the CDO which is valued in the same manner as the unhedged
portion. We have adjusted these values downward by a total of $1.1 bil-
lion to date to reflect the counterparty credit risk to the issuers of the
insurance. In addition, we held collateral in the form of cash and market-
able securities of $401 million related to our purchased insurance. The
underlying insured CDOs are collateralized with approximately 38 percent
of subprime assets of which approximately 53 percent are of higher qual-
ity vintages from 2005 and prior.
In addition, at December 31, 2008 we held $1.1 billion of purchased
insurance on our non-subprime super senior CDO exposure all of which
was provided by monolines in the form of CDS, TRS or financial guaran-
tees. At December 31, 2008, these contracts were valued at
$146 million by referencing the fair value of the CDO which is valued in
the same manner as the unhedged portion. We have adjusted these
values downward by a total of $40 million to date to reflect counterparty
credit risk to the issuers of the insurance. For more information on our
credit exposure to monolines, see Industry Concentrations beginning on
page 76.
At December 31, 2008, the carrying value of the super senior
exposure in the form of cash positions, liquidity commitments, and
derivative contracts consisted of net subprime super senior exposure of
$981 million and net non-subprime super senior exposure of $2.3 billion.
In addition, we had $2.0 billion of exposure in purchased securities from
liquidated CDOs. For more information on our super senior liquidity
exposure, see the CDO discussion beginning on page 51.
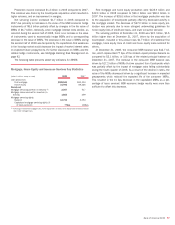
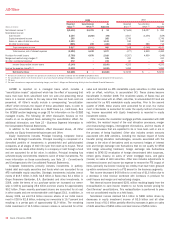
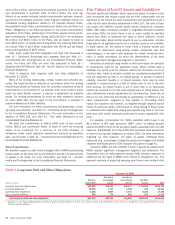
The table below presents the carrying values of our subprime net
exposures including subprime collateral content and percentages of
recent vintages.
At December 31, 2008, the Corporation did not have any subprime
super senior liquidity commitments. Net other subprime super senior
exposure was $981 million at December 31, 2008. Other subprime super
senior exposure consists primarily of cash securities and CDS on CDO
positions. The collateral supporting the high grade exposure consisted of
about 45 percent subprime content, of which approximately 12 percent
was made up of 2006 and 2007 vintages while the remaining amount
was comprised of higher quality vintages from 2005 and prior. The collat-
eral supporting the mezzanine exposure consisted of approximately 35
percent subprime content, of which approximately 66 percent is com-
prised of later vintages. We recorded losses associated with these
exposures of $3.0 billion in 2008.
In addition, at December 31, 2008, we had $2.0 billion of exposure in
purchased securities from liquidated CDOs. These purchased securities
were carried at approximately 34 percent of their original net exposure
amount and approximately 27 percent of the underlying assets are sub-
prime.
We also had net non-subprime super senior exposure of $2.3 billion
which primarily included CMBS super senior exposures and highly rated
CLO exposures. The net non-subprime super senior exposure is com-
prised of $476 million of high grade super senior liquidity commitment
exposure and $1.8 billion of high grade other super senior exposure. We
recorded losses of $592 million associated with these exposures in
2008. These losses were primarily driven by spread widening and
impairments of principal from the CMBS exposure in these super senior
CDOs. These non-subprime super senior exposures experienced addi-
tional impairments of principal as credit conditions deteriorated in the
corporate debt and commercial mortgage markets during the second half
of 2008.
In addition to the super senior exposure including purchased secu-
rities at December 31, 2008, we also had exposure with a market value
of $563 million in our CDO sales and trading portfolio, of which approx-
imately $233 million was classified as subprime. This subprime exposure
is carried at approximately 22 percent of par value and includes $137
million of secondary trading positions and $96 million of positions in
legacy warehouses.
Subprime Super Senior Collateralized Debt Obligation Carrying Values
(1)
December 31, 2008
Vintage of Subprime Collateral
(Dollars in millions)
Subprime
Net
Exposure
Carrying
Value as
a Percent
of Original
Net Exposure
Subprime
Content of
Collateral
(2)
Percent in
2006/2007
Vintages
Percent in
2005/Prior
Vintages
Other super senior exposure
High grade $ 684 38% 45% 12% 88%
Mezzanine 297 56 35 66 34
Total other super senior $ 981 42
Purchased securities from liquidated CDOs 2,030 34 27 26 74
Total $3,011 36
(1) Classified as subprime when subprime consumer real estate loans make up at least 35 percent of the ultimate underlying collateral’s original net exposure value.
(2) Based on current net exposure value.
Bank of America 2008
43