Bank of America 2008 Annual Report Download - page 60
Download and view the complete annual report
Please find page 60 of the 2008 Bank of America annual report below. You can navigate through the pages in the report by either clicking on the pages listed below, or by using the keyword search tool below to find specific information within the annual report.-
 1
1 -
2
-
3
-
4
-
5
-
6
-
7
-
8
-
9
-
10
-
11
-
12
-
13
-
14
-
15
-
16
-
17
-
18
-
19
-
20
-
21
-
22
-
23
-
24
-
25
-
26
-
27
-
28
-
29
-
30
-
31
-
32
-
33
-
34
-
35
-
36
-
37
-
38
-
39
-
40
-
41
-
42
-
43
-
44
-
45
-
46
-
47
-
48
-
49
-
 50
50 -
 51
51 -
 52
52 -
 53
53 -
 54
54 -
 55
55 -
 56
56 -
 57
57 -
 58
58 -
 59
59 -
 60
60 -
 61
61 -
 62
62 -
 63
63 -
 64
64 -
 65
65 -
 66
66 -
 67
67 -
 68
68 -
 69
69 -
 70
70 -
71
-
72
-
73
-
74
-
75
-
76
-
77
-
78
-
79
-
80
-
81
-
82
-
83
-
84
-
85
-
86
-
87
-
88
-
89
-
90
-
91
-
92
-
93
-
94
-
95
-
96
-
97
-
98
-
99
-
100
-
101
-
102
-
103
-
104
-
105
-
106
-
107
-
108
-
109
-
110
-
111
-
112
-
113
-
114
-
115
-
116
-
117
-
118
-
119
-
120
-
121
-
122
-
123
-
124
-
125
-
126
-
127
-
128
-
129
-
130
-
131
-
132
-
133
-
134
-
135
-
136
-
137
-
138
-
139
-
140
-
141
-
142
-
143
-
144
-
145
-
146
-
147
-
148
-
149
-
150
-
151
-
152
-
153
-
154
-
155
-
156
-
157
-
158
-
159
-
160
-
161
-
162
-
163
-
164
-
165
-
166
-
167
-
168
-
169
-
170
-
171
-
172
-
173
-
174
-
175
-
176
-
177
-
178
-
179
-
180
-
181
-
182
-
183
-
184
-
185
-
186
-
187
-
188
-
189
-
190
-
191
-
192
-
193
-
194
-
195
 |
 |

acquired Countrywide Bank, FSB which is regulated by the Office of Thrift
Supervision (OTS) and is, therefore, subject to OTS capital requirements.
Countrywide Bank, FSB is required by OTS regulations to maintain a
tangible equity ratio of at least two percent to avoid being classified as
“critically undercapitalized.” At December 31, 2008, Countrywide Bank,
FSB’s tangible equity ratio was 6.64 percent and was classified as “well-
capitalized” for regulatory purposes. Management believes that the
Corporation, Bank of America, N.A., FIA Card Services, N.A. and Country-
wide Bank, FSB will remain “well-capitalized.”
Certain corporate sponsored trust companies which issue trust pre-
ferred securities (Trust Securities) are not consolidated pursuant to FIN
46R. In accordance with FRB guidance, the FRB allows Trust Securities to
qualify as Tier 1 Capital with revised quantitative limits that would be
effective on March 31, 2009. As a result, we include Trust Securities in
Tier 1 Capital.
Such limits restricted core capital elements to 15 percent for interna-
tionally active bank holding companies. In addition, the FRB revised the
qualitative standards for capital instruments included in regulatory capi-
tal. Internationally active bank holding companies are those with con-
solidated assets greater than $250 billion or on-balance sheet exposure
greater than $10 billion. At December 31, 2008, the Corporation’s
restricted core capital elements comprised 14.7 percent of total core
capital elements. The Corporation expects to remain fully compliant with
the revised limits prior to the implementation date of March 31, 2009.
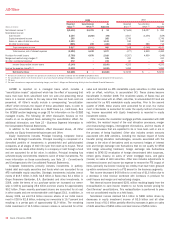
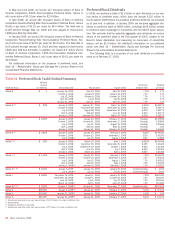
Table 12 reconciles the Corporation’s total shareholders’ equity to
Tier 1 and Total Capital as defined by the regulations issued by the FRB,
the FDIC, the OCC and the OTS at December 31, 2008 and 2007.
At December 31, 2008, the Corporation’s Tier 1 Capital, Total Capital
and Tier 1 Leverage ratios were 9.15 percent, 13.00 percent, and 6.44
percent, respectively. See Note 15 – Regulatory Requirements and
Restrictions to the Consolidated Financial Statements for more
information on the Corporation’s regulatory capital.
The Corporation calculates tangible common equity as common
shareholders’ equity less goodwill and intangible assets (excluding MSRs)
divided by total assets less goodwill and intangible assets (excluding
MSRs). Our tangible common equity ratio decreased to 2.83 percent at
December 31, 2008 as compared to 3.35 percent at December 31,
2007 as the favorable impact to common equity from the issuance of
common stock and net income during the year was more than offset by
dividend payments and an increased loss in accumulated
OCI. Management remains focused on balance sheet discipline and
reducing non-core business asset levels to improve this ratio in future
periods. Unlike the Tier 1 Capital ratio, the tangible common equity ratio
is subject to fluctuations in accumulated OCI, including unrealized losses
on AFS debt securities that we expect to return to par upon their maturity,
which adversely impacted this ratio at December 31, 2008.
On January 1, 2009, we completed the acquisition of Merrill Lynch
and subsequently issued an additional $10.0 billion of preferred stock in
connection with the TARP Capital Purchase Program. In addition, on Jan-
uary 16, 2009, the U.S. government agreed to assist in the Merrill Lynch
acquisition by making a further investment in the Corporation of $20.0
billion in preferred stock. Further, the U.S. government has agreed in
principle to provide protection against the possibility of unusually large
losses on $118.0 billion in selected capital markets exposure, primarily
from the former Merrill Lynch portfolio. As a fee for this arrangement, we
expect to issue to the U.S. Treasury and FDIC a total of $4.0 billion of a
new class of preferred stock. On a pro forma basis the net impact of the
additional capital actions and the acquisition of Merrill Lynch would result
in a Tier 1 Capital ratio of approximately 10.7 percent and tangible
common equity ratio of 2.6 percent at December 31, 2008.
Management continuously evaluates opportunities to build to the
Corporation’s capital position. During this heightened period of market
stress, there is limited ability to source meaningful private-sector capital.
Management therefore remains focused on managing asset-levels appro-
priately – ensuring we deploy TARP funds to core lending businesses and
trimming other assets in non-core businesses. The Merrill Lynch balance
sheet ended the year at approximately $650 billion; down from $875 bil-
lion at September 30, 2008. These reductions provided significant bene-
fit to capital, while not forgoing meaningful earnings to the Corporation.
Management is also focused on disciplined expense management to
further contribute to the Corporation’s capital position through earnings
generation. The government actions noted above ensures the Corporation
has adequate capital to manage through this earnings cycle, but we are
clearly focused on evaluating opportunities to repay the U. S. government
as soon as possible. Obviously the earnings environment and overall
health of markets will dictate the pace in which we are able to accomplish
these objectives. Further, management is engaged in holistic stress-
testing of the Corporation’s earnings, capital, and liquidity position.
Management recognizes the interdependencies and the importance of
planning under a wide range of potential scenarios in light of the historic
volatility witnessed over the past 18 months.
Table 12 Reconciliation of Tier 1 and Total Capital
December 31
(Dollars in millions) 2008 2007
Tier 1 Capital
Total shareholders’ equity
$177,052
$146,803
Goodwill
(81,934)
(77,530)
Nonqualifying intangible assets
(1)
(4,195)
(5,239)
Effect of net unrealized (gains) losses on AFS debt and marketable equity securities and net (gains) losses on derivatives recorded in
accumulated OCI, net-of-tax
5,479
(2,149)
Unamortized net periodic benefit costs recorded in accumulated OCI, net-of-tax
4,642
1,301
Trust securities
18,105
16,863
Other
1,665
3,323
Total Tier 1 Capital
120,814
83,372
Long-term debt qualifying as Tier 2 Capital
31,312
31,771
Allowance for loan and lease losses
23,071
11,588
Reserve for unfunded lending commitments
421
518
Other
(2)
(3,957)
6,471
Total Capital
$171,661
$133,720
(1) Nonqualifying intangible assets of the Corporation are comprised of certain core deposit intangibles, affinity relationships and other intangibles.
(2) At December 31, 2008 and 2007, includes 45 percent of the pre-tax fair value adjustment of $3.5 billion and $6.0 billion related to the Corporation’s stock investment in CCB.
58
Bank of America 2008