Bank of America 2008 Annual Report Download - page 66
Download and view the complete annual report
Please find page 66 of the 2008 Bank of America annual report below. You can navigate through the pages in the report by either clicking on the pages listed below, or by using the keyword search tool below to find specific information within the annual report.-
 1
1 -
2
-
3
-
4
-
5
-
6
-
7
-
8
-
9
-
10
-
11
-
12
-
13
-
14
-
15
-
16
-
17
-
18
-
19
-
20
-
21
-
22
-
23
-
24
-
25
-
26
-
27
-
28
-
29
-
30
-
31
-
32
-
33
-
34
-
35
-
36
-
37
-
38
-
39
-
40
-
41
-
42
-
43
-
44
-
45
-
46
-
47
-
48
-
49
-
50
-
51
-
52
-
53
-
54
-
55
-
 56
56 -
 57
57 -
 58
58 -
 59
59 -
 60
60 -
 61
61 -
 62
62 -
 63
63 -
 64
64 -
 65
65 -
 66
66 -
 67
67 -
 68
68 -
 69
69 -
 70
70 -
 71
71 -
 72
72 -
 73
73 -
 74
74 -
 75
75 -
 76
76 -
77
-
78
-
79
-
80
-
81
-
82
-
83
-
84
-
85
-
86
-
87
-
88
-
89
-
90
-
91
-
92
-
93
-
94
-
95
-
96
-
97
-
98
-
99
-
100
-
101
-
102
-
103
-
104
-
105
-
106
-
107
-
108
-
109
-
110
-
111
-
112
-
113
-
114
-
115
-
116
-
117
-
118
-
119
-
120
-
121
-
122
-
123
-
124
-
125
-
126
-
127
-
128
-
129
-
130
-
131
-
132
-
133
-
134
-
135
-
136
-
137
-
138
-
139
-
140
-
141
-
142
-
143
-
144
-
145
-
146
-
147
-
148
-
149
-
150
-
151
-
152
-
153
-
154
-
155
-
156
-
157
-
158
-
159
-
160
-
161
-
162
-
163
-
164
-
165
-
166
-
167
-
168
-
169
-
170
-
171
-
172
-
173
-
174
-
175
-
176
-
177
-
178
-
179
-
180
-
181
-
182
-
183
-
184
-
185
-
186
-
187
-
188
-
189
-
190
-
191
-
192
-
193
-
194
-
195
 |
 |

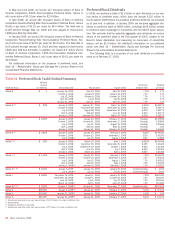
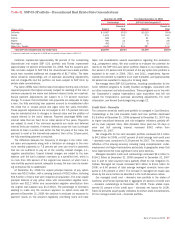
Table 17 Residential Mortgage State Concentrations
December 31, 2008
Year Ended
December 31, 2008
Outstandings Nonperforming Net Charge-offs
(Dollars in millions) Amount
Percent of
Total Amount
Percent of
Total Amount
Percent of
Total
California $ 84,847 35.6% $2,028 28.8% $411 44.4%
Florida 15,787 6.6 1,012 14.4 154 16.6
New York 15,539 6.5 255 3.6 5 0.5
Texas 10,804 4.5 315 4.5 20 2.2
Virginia 9,696 4.1 229 3.2 32 3.5
Other U.S./Foreign 101,377 42.7 3,205 45.5 303 32.8
Total residential mortgage loans (excluding SOP 03-3 loans)
$238,050 100.0% $7,044 100.0% $925 100.0%
Total SOP 03-3 residential mortgage loans (1)
9,949
Total residential mortgage loans
$247,999
(1) Represents acquired loans from Countrywide that were considered impaired and written down to fair value at the acquisition date in accordance with SOP 03-3. See page 65 for the discussion of the characteristics of
the SOP 03-3 loans.
$34.0 billion and $49.0 billion, and strengthened our Tier 1 Capital ratio
at December 31, 2008 and 2007 by 24 bps and 27 bps.
Excluding the SOP 03-3 portfolio, residential mortgage loans with
greater than 90 percent refreshed LTV represented 23 percent of the
portfolio and those loans with refreshed FICO lower than 620 represented
eight percent of the portfolio. In addition, residential mortgage loans to
borrowers in the state of California represented 36 percent and 32 per-
cent of total residential mortgage loans at December 31, 2008 and
2007. The Los Angeles-Long Beach-Santa Ana Metropolitan Statistical
Area (MSA) within California represented 13 percent and 11 percent of
the total residential mortgage portfolio at December 31, 2008 and 2007.
In addition, residential mortgage loans to borrowers in the state of Florida
represented seven percent and six percent of the total residential mort-
gage portfolio at December 31, 2008 and 2007. Additionally, 56 percent
and 40 percent of loans in California and Florida are in reference pools of
synthetic securitizations, as described above, which provide mezzanine
risk protection. Total credit risk on three percent of our mortgage loans in
Florida has been mitigated through the purchase of protection from gov-
ernment sponsored entities. The table above presents outstandings,
nonperforming loans and net charge-offs by certain state concentrations
for the residential mortgage portfolio.
The Community Reinvestment Act (CRA) encourages banks to meet
the credit needs of their communities for housing and other purposes,
particularly in neighborhoods with low or moderate incomes. At
December 31, 2008, our CRA portfolio comprised seven percent of the
total ending residential mortgage loan balances but comprised 24 per-
cent of nonperforming residential mortgage loans. This portfolio also
comprised 27 percent of residential mortgage net charge-offs during
2008. While approximately 48 percent of our residential mortgage portfo-
lio carries risk mitigation protection, only a small portion of our CRA
portfolio is covered by this protection.
Home Equity
At December 31, 2008, approximately 79 percent of the home equity
portfolio was included in GCSBB, while the remainder of the portfolio was
primarily in GWIM. Outstanding home equity loans increased $37.7 bil-
lion, or 33 percent, at December 31, 2008 compared to December 31,
2007, primarily due to the Countrywide acquisition which added approx-
imately $29.0 billion in home equity loans of which $14.2 billion is
included in the SOP 03-3 portfolio. An additional $25.0 billion in organic
growth and draws on existing lines was partially offset by paydowns and
net charge-offs. See page 65 for more information on the SOP 03-3 home
equity portfolio.
Home equity unused lines of credit totaled $107.4 billion at
December 31, 2008 compared to $120.1 billion at December 31, 2007.
The $12.7 billion decrease was driven primarily by higher account uti-
lization due to draws on existing lines as well as line management ini-
tiatives on deteriorating accounts with declining equity positions partially
offset by the addition of the Countrywide portfolio which added $4.5 bil-
lion of unused lines related to the non SOP 03-3 portfolio. The home
equity utilization rate was 52 percent at December 31, 2008 compared to
44 percent at December 31, 2007. The increase was driven by the same
factors as previously discussed as well as the addition of the Countrywide
portfolio which had a higher utilization rate.
Nonperforming home equity loans increased $1.3 billion compared to
December 31, 2007 and net charge-offs increased $3.2 billion to $3.5
billion for 2008, or 2.59 percent (2.73 percent excluding the SOP 03-3
portfolio) of total average home equity loans compared to 0.28 percent in
2007. These increases were driven by continued weakness in the hous-
ing markets, the slowing economy and seasoning of vintages originated in
periods of higher growth. Additionally, the increase was driven by high
refreshed CLTV loans in geographic areas that have experienced the most
significant declines in home prices. Home price declines coupled with the
fact that most home equity loans are secured by second lien positions
have significantly reduced and in some cases resulted in no collateral
value after consideration of the first lien position. This drove more severe
charge-offs as borrowers defaulted.
Excluding the SOP 03-3 portfolio, home equity loans with greater than
90 percent refreshed CLTV comprised 37 percent of the home equity
portfolio at December 31, 2008, and represented 85 percent of net
charge-offs for 2008. In addition, loans with a refreshed FICO lower than
620 represented 10 percent of the home equity loans at December 31,
2008. The 2006 vintage loans, which represent $34.2 billion, or 25
percent of our home equity portfolio, continue to season and have a
higher refreshed CLTV and accounted for approximately 49 percent of net
charge-offs for 2008. The portfolio’s 2007 vintages, which represent 26
percent of the portfolio, are showing similar asset quality characteristics
as the 2006 vintages and accounted for 28 percent of net charge-offs in
2008. Additionally, legacy Bank of America discontinued the program of
purchasing non-franchise originated loans in the second quarter of 2007.
These purchased loans represented only three percent of the portfolio but
accounted for 17 percent of net charge-offs for 2008.
64
Bank of America 2008