Bank of America 2008 Annual Report Download - page 112
Download and view the complete annual report
Please find page 112 of the 2008 Bank of America annual report below. You can navigate through the pages in the report by either clicking on the pages listed below, or by using the keyword search tool below to find specific information within the annual report.-
 1
1 -
2
-
3
-
4
-
5
-
6
-
7
-
8
-
9
-
10
-
11
-
12
-
13
-
14
-
15
-
16
-
17
-
18
-
19
-
20
-
21
-
22
-
23
-
24
-
25
-
26
-
27
-
28
-
29
-
30
-
31
-
32
-
33
-
34
-
35
-
36
-
37
-
38
-
39
-
40
-
41
-
42
-
43
-
44
-
45
-
46
-
47
-
48
-
49
-
50
-
51
-
52
-
53
-
54
-
55
-
56
-
57
-
58
-
59
-
60
-
61
-
62
-
63
-
64
-
65
-
66
-
67
-
68
-
69
-
70
-
71
-
72
-
73
-
74
-
75
-
76
-
77
-
78
-
79
-
80
-
81
-
82
-
83
-
84
-
85
-
86
-
87
-
88
-
89
-
90
-
91
-
92
-
93
-
94
-
95
-
96
-
97
-
98
-
99
-
100
-
101
-
 102
102 -
 103
103 -
 104
104 -
 105
105 -
 106
106 -
 107
107 -
 108
108 -
 109
109 -
 110
110 -
 111
111 -
 112
112 -
 113
113 -
 114
114 -
 115
115 -
 116
116 -
 117
117 -
 118
118 -
 119
119 -
 120
120 -
 121
121 -
 122
122 -
123
-
124
-
125
-
126
-
127
-
128
-
129
-
130
-
131
-
132
-
133
-
134
-
135
-
136
-
137
-
138
-
139
-
140
-
141
-
142
-
143
-
144
-
145
-
146
-
147
-
148
-
149
-
150
-
151
-
152
-
153
-
154
-
155
-
156
-
157
-
158
-
159
-
160
-
161
-
162
-
163
-
164
-
165
-
166
-
167
-
168
-
169
-
170
-
171
-
172
-
173
-
174
-
175
-
176
-
177
-
178
-
179
-
180
-
181
-
182
-
183
-
184
-
185
-
186
-
187
-
188
-
189
-
190
-
191
-
192
-
193
-
194
-
195
 |
 |

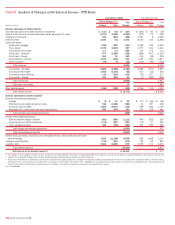
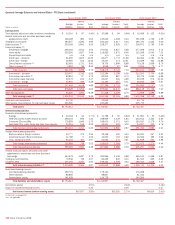
Quarterly Average Balances and Interest Rates – FTE Basis (continued)
Second Quarter 2008 First Quarter 2008 Fourth Quarter 2007
(Dollars in millions)
Average
Balance
Interest
Income/
Expense
Yield/
Rate
Average
Balance
Interest
Income/
Expense
Yield/
Rate
Average
Balance
Interest
Income/
Expense
Yield/
Rate
Earning assets
Time deposits placed and other short-term investments $ 10,310 $ 87 3.40% $ 10,596 $ 94 3.56% $ 10,459 $ 122 4.63%
Federal funds sold and securities purchased under
agreements to resell 126,169 800 2.54 145,043 1,208 3.34 151,938 1,748 4.59
Trading account assets 184,547 2,282 4.95 192,410 2,417 5.04 190,700 2,422 5.06
Debt securities
(1)
235,369 2,963 5.04 219,377 2,835 5.17 206,873 2,795 5.40
Loans and leases
(2)
:
Residential mortgage 256,164 3,541 5.54 270,541 3,837 5.68 277,058 3,972 5.73
Home equity 120,265 1,627 5.44 116,562 1,872 6.46 112,369 2,043 7.21
Discontinued real estate n/a n/a n/a n/a n/a n/a n/a n/a n/a
Credit card – domestic 61,655 1,603 10.45 63,277 1,774 11.28 60,063 1,781 11.76
Credit card – foreign 16,566 512 12.43 15,241 474 12.51 14,329 464 12.86
Direct/Indirect consumer
(3)
82,593 1,731 8.43 78,705 1,699 8.68 75,138 1,658 8.75
Other consumer
(4)
3,953 84 8.36 4,049 87 8.61 4,206 71 6.77
Total consumer 541,196 9,098 6.75 548,375 9,743 7.13 543,163 9,989 7.32
Commercial – domestic 219,537 2,762 5.06 212,394 3,198 6.06 213,200 3,704 6.89
Commercial real estate
(5)
62,810 737 4.72 62,202 887 5.74 59,702 1,053 6.99
Commercial lease financing 22,276 243 4.37 22,227 261 4.69 22,239 574 10.33
Commercial – foreign 32,820 366 4.48 30,463 387 5.11 29,815 426 5.67
Total commercial 337,443 4,108 4.89 327,286 4,733 5.81 324,956 5,757 7.03
Total loans and leases 878,639 13,206 6.04 875,661 14,476 6.64 868,119 15,746 7.21
Other earning assets 65,200 1,005 6.19 67,208 1,129 6.75 74,909 1,296 6.89
Total earning assets (6) 1,500,234 20,343 5.44 1,510,295 22,159 5.89 1,502,998 24,129 6.39
Cash and cash equivalents 33,799 33,949 33,714
Other assets, less allowance for loan and lease losses 220,580 220,683 205,755
Total assets $1,754,613 $1,764,927 $1,742,467
Interest-bearing liabilities
Domestic interest-bearing deposits:
Savings $ 33,164 $ 64 0.77% $ 31,798 $ 50 0.63% $ 31,961 $ 50 0.63%
NOW and money market deposit accounts 258,104 856 1.33 248,949 1,139 1.84 240,914 1,334 2.20
Consumer CDs and IRAs 178,828 1,646 3.70 188,005 2,071 4.43 183,910 2,179 4.70
Negotiable CDs, public funds and other time deposits 24,216 195 3.25 32,201 320 4.00 34,997 420 4.76
Total domestic interest-bearing deposits 494,312 2,761 2.25 500,953 3,580 2.87 491,782 3,983 3.21
Foreign interest-bearing deposits:
Banks located in foreign countries 33,777 272 3.25 39,196 400 4.10 45,050 557 4.91
Governments and official institutions 11,789 77 2.62 14,650 132 3.62 16,506 192 4.62
Time, savings and other 55,403 410 2.97 53,064 476 3.61 51,919 521 3.98
Total foreign interest-bearing deposits 100,969 759 3.02 106,910 1,008 3.79 113,475 1,270 4.44
Total interest-bearing deposits 595,281 3,520 2.38 607,863 4,588 3.04 605,257 5,253 3.44
Federal funds purchased, securities sold under
agreements to repurchase and other short-term
borrowings 444,578 3,087 2.79 452,854 4,142 3.68 456,530 5,598 4.87
Trading account liabilities 70,546 749 4.27 82,432 840 4.10 81,500 825 4.02
Long-term debt 205,194 2,050 4.00 198,463 2,298 4.63 196,444 2,638 5.37
Total interest-bearing liabilities (6) 1,315,599 9,406 2.87 1,341,612 11,868 3.55 1,339,731 14,314 4.25
Noninterest-bearing sources:
Noninterest-bearing deposits 190,721 179,760 176,368
Other liabilities 86,865 88,827 81,444
Shareholders’ equity 161,428 154,728 144,924
Total liabilities and shareholders’ equity $1,754,613 $1,764,927 $1,742,467
Net interest spread 2.57% 2.34% 2.14%
Impact of noninterest-bearing sources 0.35 0.39 0.47
Net interest income/yield on earning assets $10,937 2.92% $10,291 2.73% $9,815 2.61%
For Footnotes, see page 109.
n/a = not applicable
110
Bank of America 2008