Bank of America 2008 Annual Report Download - page 2
Download and view the complete annual report
Please find page 2 of the 2008 Bank of America annual report below. You can navigate through the pages in the report by either clicking on the pages listed below, or by using the keyword search tool below to find specific information within the annual report.-
 1
1 -
 2
2 -
 3
3 -
 4
4 -
 5
5 -
 6
6 -
 7
7 -
 8
8 -
 9
9 -
 10
10 -
 11
11 -
 12
12 -
 13
13 -
14
-
15
-
16
-
17
-
18
-
19
-
20
-
21
-
22
-
23
-
24
-
25
-
26
-
27
-
28
-
29
-
30
-
31
-
32
-
33
-
34
-
35
-
36
-
37
-
38
-
39
-
40
-
41
-
42
-
43
-
44
-
45
-
46
-
47
-
48
-
49
-
50
-
51
-
52
-
53
-
54
-
55
-
56
-
57
-
58
-
59
-
60
-
61
-
62
-
63
-
64
-
65
-
66
-
67
-
68
-
69
-
70
-
71
-
72
-
73
-
74
-
75
-
76
-
77
-
78
-
79
-
80
-
81
-
82
-
83
-
84
-
85
-
86
-
87
-
88
-
89
-
90
-
91
-
92
-
93
-
94
-
95
-
96
-
97
-
98
-
99
-
100
-
101
-
102
-
103
-
104
-
105
-
106
-
107
-
108
-
109
-
110
-
111
-
112
-
113
-
114
-
115
-
116
-
117
-
118
-
119
-
120
-
121
-
122
-
123
-
124
-
125
-
126
-
127
-
128
-
129
-
130
-
131
-
132
-
133
-
134
-
135
-
136
-
137
-
138
-
139
-
140
-
141
-
142
-
143
-
144
-
145
-
146
-
147
-
148
-
149
-
150
-
151
-
152
-
153
-
154
-
155
-
156
-
157
-
158
-
159
-
160
-
161
-
162
-
163
-
164
-
165
-
166
-
167
-
168
-
169
-
170
-
171
-
172
-
173
-
174
-
175
-
176
-
177
-
178
-
179
-
180
-
181
-
182
-
183
-
184
-
185
-
186
-
187
-
188
-
189
-
190
-
191
-
192
-
193
-
194
-
195
 |
 |
$60
$50
$40
$30
$20
$0
$10
$160
$180
$200
$140
$120
$100
$80
$60
$40
$20
$0
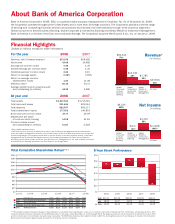
Bank of America Corporation (NYSE: BAC) is a publicly traded company headquartered in Charlotte, NC. As of December 31, 2008,
the Corporation operated throughout the United States and in more than 30 foreign countries. The Corporation provides a diverse range
of banking and nonbanking financial services and products domestically and internationally through three business segments:
Global Consumer & Small Business Banking, Global Corporate & Investment Banking and Global Wealth & Investment Management.
Bank of America is a member of the Dow Jones Industrial Average. The Corporation acquired Merrill Lynch & Co., Inc. on January 1, 2009.
At year end 2008 2007
Total assets $1,817,943 $1,715,746
Total loans and leases 931,446 876,344
Total deposits 882,997 805,177
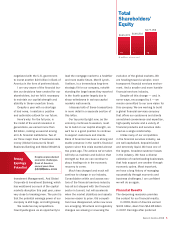
Total shareholders’ equity 177,052 146,803
Book value per common share 27.77 32.09
Market price per share
of common stock (closing) 14.08 41.26
Common shares issued
and outstanding (in millions) 5,017 4,438
About Bank of America Corporation
*Fully taxable-equivalent basis
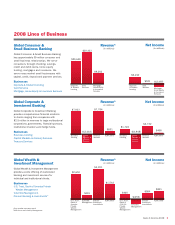
**All Other consists primarily of equity investments, the residential mortgage portfolio associated with
asset and liability management activities, the residual impact of the cost allocation processes, merger and
restructuring charges, intersegment eliminations, and the results of certain consumer fi nance, investment
management and commercial lending businesses that are being liquidated. All Other also includes the
offsetting securitization impact to present Card Services on a managed basis. Our view of Global Consumer
& Small Business Banking operations are also shown on a managed basis.
Financial Highlights
(Dollars in millions, except per share information)
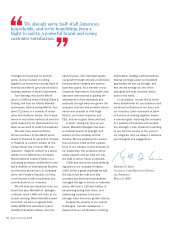
Total Cumulative Shareholder Return*** 5-Year Stock Performance
***This graph compares the yearly change in the Corporation’s cumulative total shareholders’ return on its common stock with (i) Standard & Poor’s 500 Index, (ii) Standard & Poor’s 500
Commercial Banks Industry Index and (iii) the KBW Bank Index for the years ended December 31, 2004 through 2008. The graph assumes an initial investment of $100 at the end of 2003
and the reinvestment of all dividends during the years indicated. The KBW Bank Index has been added to better refl ect the evolving fi nancial sector and because it includes the stock price
performance of a broader range of larger diversifi ed U.S. fi nancial services companies.
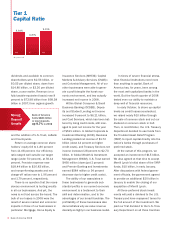
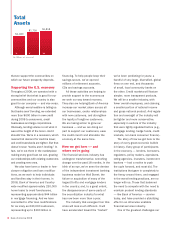
Net Income
(in millions)
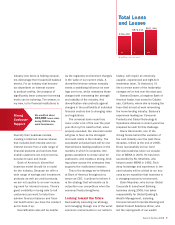
Revenue*
(in millions)
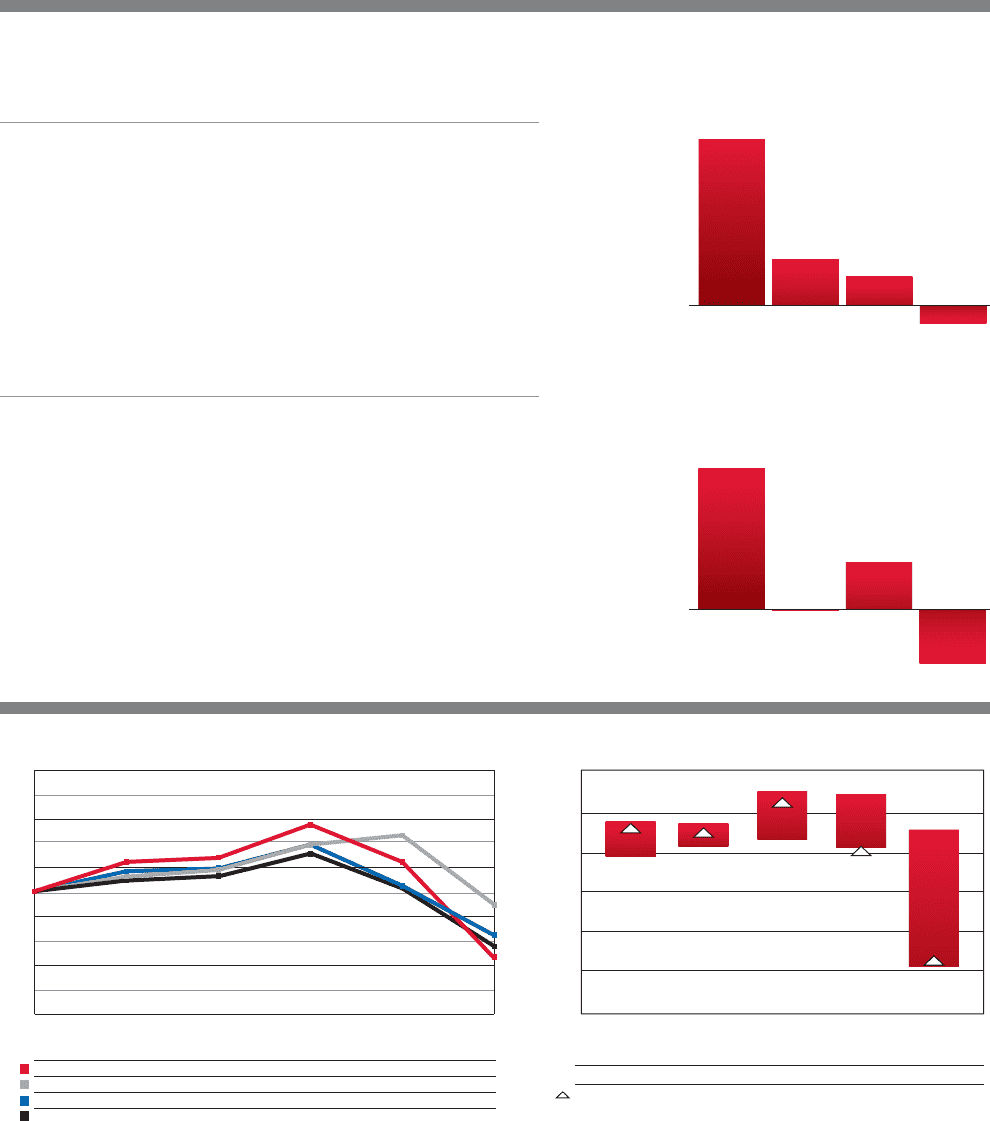
High $47.44 $47.08 $54.90 $54.05 $4 5.03
Low 38.96 41.57 43.09 41.10 11.25
Close 46.99 46.15 53.39 41.26 14.08
2004 2005 2006 2007 2008
12/03 12/04 12/05 12/06 12/07 12/08
Global
Consumer
& Small
Business
Banking
Global
Corporate &
Investment
Banking
Global
Wealth &
Investment
Management All Other**
$4,234
106%
$(14)
(1)%
$1,416
35%
$(1,628)
(40)%
Global
Consumer
& Small
Business
Banking
Global
Corporate &
Investment
Banking
Global
Wealth &
Investment
Management
All Other**
$58,344
79%
$13,440
18% $7,785
11% $(5,593)
(8)%
For the year 2008 2007
Revenue, net of interest expense* $73,976 $68,582
Net income 4,008 14,982
Earnings per common share 0.56 3.35
Diluted earnings per common share 0.55 3.30
Dividends paid per common share 2.24 2.40
Return on average assets 0.22 % 0.94 %
Return on average common
shareholders’ equity 1.80 11.08
Efficiency ratio* 56.14 54.71
Average diluted common shares issued
and outstanding (in millions) 4,612 4,480
December 31 2003 2004 2005 2006 2007 2008
BAC Bank of America Corporation $100 $122 $125 $150 $122 $45
SPX S & P 500 Index $100 $111 $116 $135 $142 $90
S5CBNK S & P 500 CM Banks Index $100 $115 $117 $135 $104 $67
BKX KBW Bank Index $100 $110 $114 $133 $104 $55