Bank of America 2008 Annual Report Download - page 187
Download and view the complete annual report
Please find page 187 of the 2008 Bank of America annual report below. You can navigate through the pages in the report by either clicking on the pages listed below, or by using the keyword search tool below to find specific information within the annual report.-
 1
1 -
2
-
3
-
4
-
5
-
6
-
7
-
8
-
9
-
10
-
11
-
12
-
13
-
14
-
15
-
16
-
17
-
18
-
19
-
20
-
21
-
22
-
23
-
24
-
25
-
26
-
27
-
28
-
29
-
30
-
31
-
32
-
33
-
34
-
35
-
36
-
37
-
38
-
39
-
40
-
41
-
42
-
43
-
44
-
45
-
46
-
47
-
48
-
49
-
50
-
51
-
52
-
53
-
54
-
55
-
56
-
57
-
58
-
59
-
60
-
61
-
62
-
63
-
64
-
65
-
66
-
67
-
68
-
69
-
70
-
71
-
72
-
73
-
74
-
75
-
76
-
77
-
78
-
79
-
80
-
81
-
82
-
83
-
84
-
85
-
86
-
87
-
88
-
89
-
90
-
91
-
92
-
93
-
94
-
95
-
96
-
97
-
98
-
99
-
100
-
101
-
102
-
103
-
104
-
105
-
106
-
107
-
108
-
109
-
110
-
111
-
112
-
113
-
114
-
115
-
116
-
117
-
118
-
119
-
120
-
121
-
122
-
123
-
124
-
125
-
126
-
127
-
128
-
129
-
130
-
131
-
132
-
133
-
134
-
135
-
136
-
137
-
138
-
139
-
140
-
141
-
142
-
143
-
144
-
145
-
146
-
147
-
148
-
149
-
150
-
151
-
152
-
153
-
154
-
155
-
156
-
157
-
158
-
159
-
160
-
161
-
162
-
163
-
164
-
165
-
166
-
167
-
168
-
169
-
170
-
171
-
172
-
173
-
174
-
175
-
176
-
 177
177 -
 178
178 -
 179
179 -
 180
180 -
 181
181 -
 182
182 -
 183
183 -
 184
184 -
 185
185 -
 186
186 -
 187
187 -
 188
188 -
 189
189 -
 190
190 -
 191
191 -
 192
192 -
 193
193 -
 194
194 -
 195
195
 |
 |

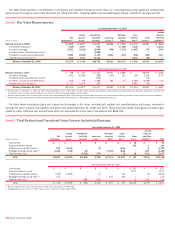
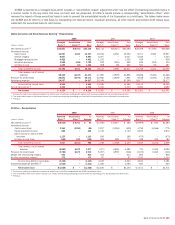
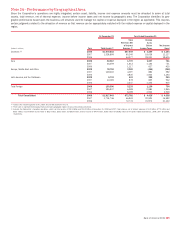
GCSBB is reported on a managed basis which includes a “securitization impact” adjustment which has the effect of presenting securitized loans in
a manner similar to the way loans that have not been sold are presented. All Other’s results include a corresponding “securitization offset” which
removes the impact of these securitized loans in order to present the consolidated results of the Corporation on a held basis. The tables below recon-
cile GCSBB and All Other to a held basis by reclassifying net interest income, insurance premiums, all other income and realized credit losses asso-
ciated with the securitized loans to card income.
Global Consumer and Small Business Banking – Reconciliation
2008 2007 2006
(Dollars in millions)
Managed
Basis
(1)
Securitization
Impact
(2)
Held
Basis
Managed
Basis
(1)
Securitization
Impact
(2)
Held
Basis
Managed
Basis
(1)
Securitization
Impact
(2)
Held
Basis
Net interest income
(3)
$33,851
$(8,701) $25,150 $28,712 $(8,027) $20,685 $28,059 $(7,593) $20,466
Noninterest income:
Card income
10,057
2,250 12,307 10,194 3,356 13,550 9,371 4,566 13,937
Service charges
6,807
– 6,807 6,007 – 6,007 5,344 – 5,344
Mortgage banking income
4,422
– 4,422 1,332 – 1,332 919 – 919
Insurance premiums
1,968
(186) 1,782 912 (250) 662 615 (302) 313
All other income
1,239
(33) 1,206 698 (38) 660 520 (33) 487
Total noninterest income
24,493
2,031 26,524 19,143 3,068 22,211 16,769 4,231 21,000
Total revenue, net of interest
expense
58,344
(6,670) 51,674 47,855 (4,959) 42,896 44,828 (3,362) 41,466
Provision for credit losses
26,841
(6,670) 20,171 12,920 (4,959) 7,961 8,518 (3,362) 5,156
Noninterest expense
24,937
– 24,937 20,349 – 20,349 18,177 – 18,177
Income before income taxes
6,566
– 6,566 14,586 – 14,586 18,133 – 18,133
Income tax expense
(3)
2,332
– 2,332 5,224 – 5,224 6,682 – 6,682
Net income
$ 4,234
$ – $ 4,234 $ 9,362 $ – $ 9,362 $11,451 $ – $11,451
(1) Provision for credit losses represents provision for credit losses on held loans combined with realized credit losses associated with the securitized loan portfolio.
(2) The securitization impact on net interest income is on a funds transfer pricing methodology consistent with the way funding costs are allocated to the businesses.
(3) FTE basis
All Other – Reconciliation
2008 2007 2006
(Dollars in millions)
Reported
Basis
(1)
Securitization
Offset
(2)
As
Adjusted
Reported
Basis
(1)
Securitization
Offset
(2)
As
Adjusted
Reported
Basis
(1)
Securitization
Offset
(2)
As
Adjusted
Net interest income
(3)
$(8,610)
$ 8,701 $ 91 $(7,645) $ 8,027 $ 382 $(5,909) $7,593 $1,684
Noninterest income:
Card income (loss)
2,164
(2,250) (86) 2,817 (3,356) (539) 3,795 (4,566) (771)
Equity investment income
265
– 265 3,745 – 3,745 2,872 – 2,872
Gains (losses) on sales of debt
securities
1,133
– 1,133 180 – 180 (475) – (475)
All other income (loss)
(545)
219 (326) 426 288 714 448 335 783
Total noninterest income
3,017
(2,031) 986 7,168 (3,068) 4,100 6,640 (4,231) 2,409
Total revenue, net of interest
expense
(5,593)
6,670 1,077 (477) 4,959 4,482 731 3,362 4,093
Provision for credit losses
(3,760)
6,670 2,910 (5,207) 4,959 (248) (3,475) 3,362 (113)
Merger and restructuring charges
935
– 935 410 – 410 805 – 805
All other noninterest expense
372
– 372 87 – 87 1,210 – 1,210
Income (loss) before income taxes
(3,140)
– (3,140) 4,233 – 4,233 2,191 – 2,191
Income tax expense (benefit) (3)
(1,512)
– (1,512) 1,083 – 1,083 620 – 620
Net income (loss)
$(1,628)
$ – $(1,628) $ 3,150 $ – $3,150 $ 1,571 $ – $1,571
(1) Provision for credit losses represents provision for credit losses in All Other combined with the GCSBB securitization offset.
(2) The securitization offset on net interest income is on a funds transfer pricing methodology consistent with the way funding costs are allocated to the businesses.
(3) FTE basis
Bank of America 2008
185