Bank of America 2008 Annual Report Download - page 184
Download and view the complete annual report
Please find page 184 of the 2008 Bank of America annual report below. You can navigate through the pages in the report by either clicking on the pages listed below, or by using the keyword search tool below to find specific information within the annual report.-
 1
1 -
2
-
3
-
4
-
5
-
6
-
7
-
8
-
9
-
10
-
11
-
12
-
13
-
14
-
15
-
16
-
17
-
18
-
19
-
20
-
21
-
22
-
23
-
24
-
25
-
26
-
27
-
28
-
29
-
30
-
31
-
32
-
33
-
34
-
35
-
36
-
37
-
38
-
39
-
40
-
41
-
42
-
43
-
44
-
45
-
46
-
47
-
48
-
49
-
50
-
51
-
52
-
53
-
54
-
55
-
56
-
57
-
58
-
59
-
60
-
61
-
62
-
63
-
64
-
65
-
66
-
67
-
68
-
69
-
70
-
71
-
72
-
73
-
74
-
75
-
76
-
77
-
78
-
79
-
80
-
81
-
82
-
83
-
84
-
85
-
86
-
87
-
88
-
89
-
90
-
91
-
92
-
93
-
94
-
95
-
96
-
97
-
98
-
99
-
100
-
101
-
102
-
103
-
104
-
105
-
106
-
107
-
108
-
109
-
110
-
111
-
112
-
113
-
114
-
115
-
116
-
117
-
118
-
119
-
120
-
121
-
122
-
123
-
124
-
125
-
126
-
127
-
128
-
129
-
130
-
131
-
132
-
133
-
134
-
135
-
136
-
137
-
138
-
139
-
140
-
141
-
142
-
143
-
144
-
145
-
146
-
147
-
148
-
149
-
150
-
151
-
152
-
153
-
154
-
155
-
156
-
157
-
158
-
159
-
160
-
161
-
162
-
163
-
164
-
165
-
166
-
167
-
168
-
169
-
170
-
171
-
172
-
173
-
 174
174 -
 175
175 -
 176
176 -
 177
177 -
 178
178 -
 179
179 -
 180
180 -
 181
181 -
 182
182 -
 183
183 -
 184
184 -
 185
185 -
 186
186 -
 187
187 -
 188
188 -
 189
189 -
 190
190 -
 191
191 -
 192
192 -
 193
193 -
 194
194 -
195
 |
 |

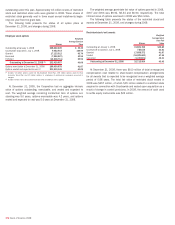
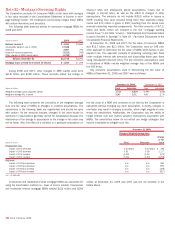
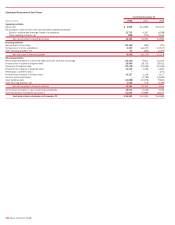
Note 21 – Mortgage Servicing Rights
The Corporation accounts for consumer MSRs at fair value with changes
in fair value recorded in the Consolidated Statement of Income in mort-
gage banking income. The Corporation economically hedges these MSRs
with certain derivatives and securities.
The following table presents activity for consumer mortgage MSRs for
2008 and 2007.
(Dollars in millions) 2008 2007
Balance, January 1
$ 3,053
$2,869
Countrywide balance, July 1, 2008
17,188
–
Additions
2,587
792
Impact of customer payments
(3,313)
(766)
Other changes in MSR market value
(6,782)
158
Balance, December 31
$12,733
$3,053
Mortgage loans serviced for investors (in billions)
$ 1,654
$ 259
During 2008 and 2007, other changes in MSR market value were
$(6.8) billion and $158 million. These amounts reflect the change in
discount rates and prepayment speed assumptions, mostly due to
changes in interest rates, as well as the effect of changes in other
assumptions. The amounts do not include $(333) million in losses in
2008 resulting from cash received being lower than expected prepay-
ments and $73 million in gains in 2007 resulting from the actual cash
received exceeding expected prepayments. The total amounts of $(7.1)
billion and $231 million are included in the line “mortgage banking
income (loss)” in the table “Level 3 – Total Realized and Unrealized Gains
(Losses) Included in Earnings” in Note 19 – Fair Value Disclosures to the
Consolidated Financial Statements.
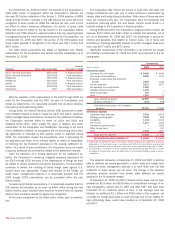
At December 31, 2008 and 2007, the fair value of consumer MSRs
was $12.7 billion and $3.1 billion. The Corporation uses an OAS valu-
ation approach to determine the fair value of MSRs which factors in pre-
payment risk. This approach consists of projecting servicing cash flows
under multiple interest rate scenarios and discounting these cash flows
using risk-adjusted discount rates. The key economic assumptions used
in valuations of MSRs include weighted average lives of the MSRs and
the OAS levels.
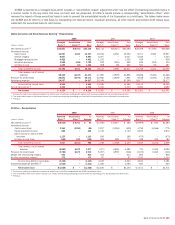
Key economic assumptions used in determining the fair value of
MSRs at December 31, 2008 and 2007 were as follows:
December 31, 2008 December 31, 2007
(Dollars in millions) Fixed Adjustable Fixed Adjustable
Weighted average option adjusted spread
1.71% 6.40%
0.59% 2.54%
Weighted average life, in years
3.26 2.71
4.80 2.75
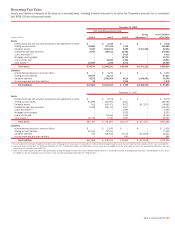
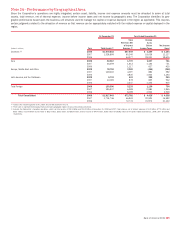
The following table presents the sensitivity of the weighted average
lives and fair value of MSRs to changes in modeled assumptions. The
sensitivities in the following table are hypothetical and should be used
with caution. As the amounts indicate, changes in fair value based on
variations in assumptions generally cannot be extrapolated because the
relationship of the change in assumption to the change in fair value may
not be linear. Also, the effect of a variation in a particular assumption on
the fair value of a MSR that continues to be held by the Corporation is
calculated without changing any other assumption. In reality, changes in
one factor may result in changes in another, which might magnify or coun-
teract the sensitivities. Additionally, the Corporation has the ability to
hedge interest rate and market valuation fluctuations associated with
MSRs. The sensitivities below do not reflect any hedge strategies that
may be undertaken to mitigate such risk.
December 31, 2008
Change in Weighted Average Lives
(Dollars in millions) Fixed Adjustable
Change
in Fair
Value
Prepayment rates
Impact of 10% decrease 0.23 years 0.13 years $ 786
Impact of 20% decrease 0.51 0.28 1,717
Impact of 10% increase (0.20) (0.11) (674)
Impact of 20% increase (0.36) (0.20) (1,258)
OAS level
Impact of 100 bps decrease n/a n/a 460
Impact of 200 bps decrease n/a n/a 955
Impact of 100 bps increase n/a n/a (428)
Impact of 200 bps increase n/a n/a (827)
n/a = not applicable
Commercial and residential reverse mortgage MSRs are accounted for
using the amortization method (i.e., lower of cost or market). Commercial
and residential reverse mortgage MSRs totaled $323 million and $294
million at December 31, 2008 and 2007 and are not included in the
tables above.
182
Bank of America 2008